

| Tool and Viewer Quick Start | |
LTI Viewer
LTI Viewer is a graphical user interface (GUI) that simplifies the analysis of linear, time-invariant systems. You use the LTI Viewer to view and compare the response plots of SISO and MIMO systems, or of several linear models at the same time. You can generate time and frequency response plots to inspect key response parameters, such as rise time, maximum overshoot, and stability margins.
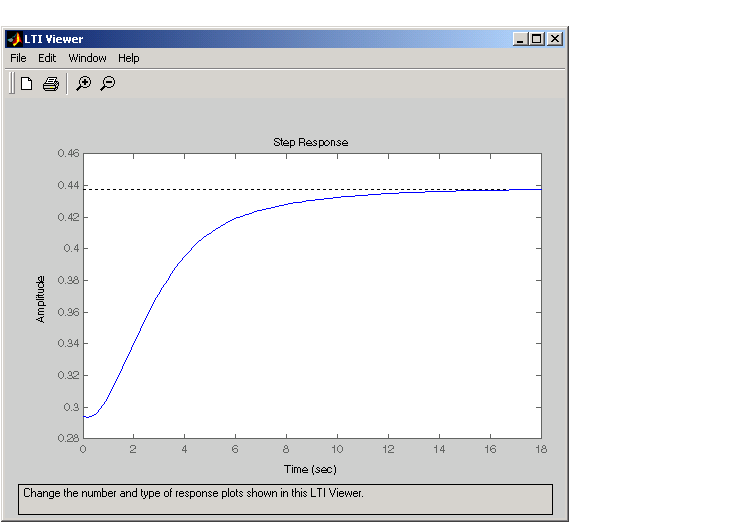
The LTI Viewer can display up to seven different plot types simultaneously, including step, impulse, Bode (magnitude and phase or magnitude only), Nyquist, Nichols, sigma, pole/zero, and I/O pole/zero.
Using right-click menu options, you can access several LTI Viewer controls and options, including:
In addition to right-click menus, all response plots include data markers. These allow you to scan the plot data, identify key data, and determine the source system for a given plot.
The LTI Viewer has a tool bar that you can use to do the following:
For descriptions of basic tasks you can perform with the LTI Viewer, see the other Help menu items:
For examples of how to use the LTI Viewer, see Analyzing Models in Getting Started with the Control System Toolbox. See LTI Viewer for descriptions of all the features available in the LTI Viewer.
See ltiview for help on the function that opens an LTI Viewer.
| | Customizing the SISO Design Tool | Importing and Exporting Models | |