| Statistics Toolbox | |
Gamma Distribution
The following sections provide an overview of the gamma distribution.
Background of the Gamma Distribution
The gamma distribution is a family of curves based on two parameters. The chi-square and exponential distributions, which are children of the gamma distribution, are one-parameter distributions that fix one of the two gamma parameters.
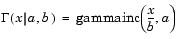
The gamma distribution has the following relationship with the incomplete Gamma function.
For b = 1 the functions are identical.
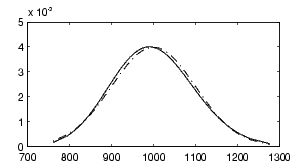
When a is large, the gamma distribution closely approximates a normal distribution with the advantage that the gamma distribution has density only for positive real numbers.
Definition of the Gamma Distribution
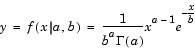
where  ( · ) is the Gamma function.
Parameter Estimation for the Gamma Distribution
Suppose you are stress testing computer memory chips and collecting data on their lifetimes. You assume that these lifetimes follow a gamma distribution. You want to know how long you can expect the average computer memory chip to last. Parameter estimation is the process of determining the parameters of the gamma distribution that fit this data best in some sense.
One popular criterion of goodness is to maximize the likelihood function. The likelihood has the same form as the gamma pdf above. But for the pdf, the parameters are known constants and the variable is x. The likelihood function reverses the roles of the variables. Here, the sample values (the x's) are already observed. So they are the fixed constants. The variables are the unknown parameters. MLE involves calculating the values of the parameters that give the highest likelihood given the particular set of data.
The function gamfit returns the MLEs and confidence intervals for the parameters of the gamma distribution. Here is an example using random numbers from the gamma distribution with a = 10 and b = 5.
lifetimes = gamrnd(10,5,100,1);
[phat, pci] = gamfit(lifetimes)
phat =
   10.9821    4.7258
pci =
    7.4001    3.1543
   14.5640    6.2974
Note phat(1) =  and
and phat(2) =  . The MLE for parameter a is 10.98, compared to the true value of 10. The 95% confidence interval for a goes from 7.4 to 14.6, which includes the true value.
Similarly the MLE for parameter b is 4.7, compared to the true value of 5. The 95% confidence interval for b goes from 3.2 to 6.3, which also includes the true value.
In our life tests we do not know the true value of a and b so it is nice to have a confidence interval on the parameters to give a range of likely values.
Example and Plot of the Gamma Distribution
In the example the gamma pdf is plotted with the solid line. The normal pdf has a dashed line type.
x = gaminv((0.005:0.01:0.995),100,10);
y = gampdf(x,100,10);
y1 = normpdf(x,1000,100);
plot(x,y,'-',x,y1,'-.')
| | Noncentral F Distribution | Geometric Distribution | |