| Statistics Toolbox | |
Hierarchical Clustering
Hierarchical clustering is a way to investigate grouping in your data, simultaneously over a variety of scales, by creating a cluster tree. The tree is not a single set of clusters, but rather a multi-level hierarchy, where clusters at one level are joined as clusters at the next higher level. This allows you to decide what level or scale of clustering is most appropriate in your application.
The following sections explore the hierarchical clustering features in the Statistics Toolbox:
Terminology and Basic Procedure
To perform hierarchical cluster analysis on a data set using the Statistics Toolbox functions, follow this procedure:
pdist function. The pdist function supports many different ways to compute this measurement. See Finding the Similarities Between Objects for more information.
linkage function. The linkage function uses the distance information generated in step 1 to determine the proximity of objects to each other. As objects are paired into binary clusters, the newly formed clusters are grouped into larger clusters until a hierarchical tree is formed. See Defining the Links Between Objects for more information.
cluster function. The cluster function can create clusters by detecting natural groupings in the hierarchical tree or by cutting off the hierarchical tree at an arbitrary point. See Creating Clusters for more information.
The following sections provide more information about each of these steps.
Note
The Statistics Toolbox includes a convenience function, clusterdata, which performs all these steps for you. You do not need to execute the pdist, linkage, or cluster functions separately. However, the clusterdata function does not give you access to the options each of the individual routines offers. For example, if you use the pdist function you can choose the distance calculation method, whereas if you use the clusterdata function you cannot.
|
Finding the Similarities Between Objects
You use the pdist function to calculate the distance between every pair of objects in a data set. For a data set made up of m objects, there are  pairs in the data set. The result of this computation is commonly known as a distance or dissimilarity matrix.
There are many ways to calculate this distance information. By default, the pdist function calculates the Euclidean distance between objects; however, you can specify one of several other options. See pdist for more information.
Note
You can optionally normalize the values in the data set before calculating the distance information. In a real world data set, variables can be measured against different scales. For example, one variable can measure Intelligence Quotient (IQ) test scores and another variable can measure head circumference. These discrepancies can distort the proximity calculations. Using the zscore function, you can convert all the values in the data set to use the same proportional scale. See zscore for more information.
|
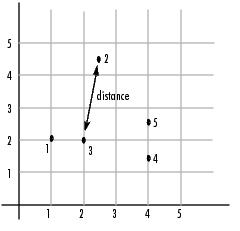
For example, consider a data set, X, made up of five objects where each object is a set of x,y coordinates.
You can define this data set as a matrix
and pass it to pdist. The pdist function calculates the distance between object 1 and object 2, object 1 and object 3, and so on until the distances between all the pairs have been calculated. The following figure plots these objects in a graph. The distance between object 2 and object 3 is shown to illustrate one interpretation of distance.
Returning Distance Information . The pdist function returns this distance information in a vector, Y, where each element contains the distance between a pair of objects.
Y = pdist(X)
Y =
  Columns 1 through 7
    2.9155    1.0000    3.0414    3.0414    2.5495    3.3541    2.5000
  Columns 8 through 10
    2.0616    2.0616    1.0000
To make it easier to see the relationship between the distance information generated by pdist and the objects in the original data set, you can reformat the distance vector into a matrix using the squareform function. In this matrix, element i,j corresponds to the distance between object i and object j in the original data set. In the following example, element 1,1 represents the distance between object 1 and itself (which is zero). Element 1,2 represents the distance between object 1 and object 2, and so on.
squareform(Y)
ans =
         0    2.9155    1.0000    3.0414    3.0414
    2.9155         0    2.5495    3.3541    2.5000
    1.0000    2.5495         0    2.0616    2.0616
    3.0414    3.3541    2.0616         0    1.0000
    3.0414    2.5000    2.0616    1.0000         0
Defining the Links Between Objects
Once the proximity between objects in the data set has been computed, you can determine which objects in the data set should be grouped together into clusters, using the linkage function. The linkage function takes the distance information generated by pdist and links pairs of objects that are close together into binary clusters (clusters made up of two objects). The linkage function then links these newly formed clusters to other objects to create bigger clusters until all the objects in the original data set are linked together in a hierarchical tree.
For example, given the distance vector Y generated by pdist from the sample data set of x and y coordinates, the linkage function generates a hierarchical cluster tree, returning the linkage information in a matrix, Z.
Z = linkage(Y)
Z =
    1.0000    3.0000    1.0000
    4.0000    5.0000    1.0000
    6.0000    7.0000    2.0616
    8.0000    2.0000    2.5000
In this output, each row identifies a link. The first two columns identify the objects that have been linked, that is, object 1, object 2, and so on. The third column contains the distance between these objects. For the sample data set of x and y coordinates, the linkage function begins by grouping together objects 1 and 3, which have the closest proximity (distance value = 1.0000). The linkage function continues by grouping objects 4 and 5, which also have a distance value of 1.0000.
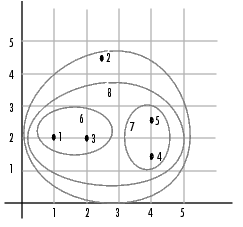
The third row indicates that the linkage function grouped together objects 6 and 7. If our original sample data set contained only five objects, what are objects 6 and 7? Object 6 is the newly formed binary cluster created by the grouping of objects 1 and 3. When the linkage function groups two objects together into a new cluster, it must assign the cluster a unique index value, starting with the value m+1, where m is the number of objects in the original data set. (Values 1 through m are already used by the original data set.) Object 7 is the index for the cluster formed by objects 4 and 5.
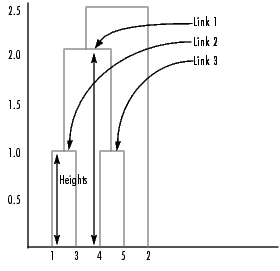
As the final cluster, the linkage function grouped object 8, the newly formed cluster made up of objects 6 and 7, with object 2 from the original data set. The following figure graphically illustrates the way linkage groups the objects into a hierarchy of clusters.
Plotting the Cluster Tree
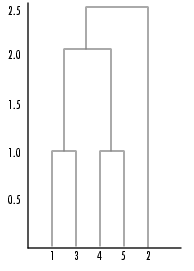
The hierarchical, binary cluster tree created by the linkage function is most easily understood when viewed graphically. The Statistics Toolbox includes the dendrogram function that plots this hierarchical tree information as a graph, as in the following example.
In the figure, the numbers along the horizontal axis represent the indices of the objects in the original data set. The links between objects are represented as upside down U-shaped lines. The height of the U indicates the distance between the objects. For example, the link representing the cluster containing objects 1 and 3 has a height of 1. For more information about creating a dendrogram diagram, see the dendrogram function reference page.
Evaluating Cluster Formation
After linking the objects in a data set into a hierarchical cluster tree, you may want to verify that the tree represents significant similarity groupings. In addition, you may want more information about the links between the objects. The Statistics Toolbox provides functions to perform both these tasks, as described in the following sections:
Verifying the Cluster Tree. One way to measure the validity of the cluster information generated by the linkage function is to compare it with the original proximity data generated by the pdist function. If the clustering is valid, the linking of objects in the cluster tree should have a strong correlation with the distances between objects in the distance vector. The cophenet function compares these two sets of values and computes their correlation, returning a value called the cophenetic correlation coefficient. The closer the value of the cophenetic correlation coefficient is to 1, the better the clustering solution.
You can use the cophenetic correlation coefficient to compare the results of clustering the same data set using different distance calculation methods or clustering algorithms.
For example, you can use the cophenet function to evaluate the clusters created for the sample data set
where Z is the matrix output by the linkage function and Y is the distance vector output by the pdist function.
Execute pdist again on the same data set, this time specifying the City Block metric. After running the linkage function on this new pdist output, use the cophenet function to evaluate the clustering using a different distance metric.
The cophenetic correlation coefficient shows a stronger correlation when the City Block metric is used.
Getting More Information About Cluster Links. One way to determine the natural cluster divisions in a data set is to compare the height of each link in a cluster tree with the heights of neighboring links below it in the tree.
If a link is approximately the same height as neighboring links, it indicates that there are similarities between the objects joined at this level of the hierarchy. These links are said to exhibit a high level of consistency.
If the height of a link differs from neighboring links, it indicates that there are dissimilarities between the objects at this level in the cluster tree. This link is said to be inconsistent with the links around it. In cluster analysis, inconsistent links can indicate the border of a natural division in a data set. The cluster function uses a measure of inconsistency to determine where to divide a data set into clusters. (See Creating Clusters for more information.)
The next section provides an example.
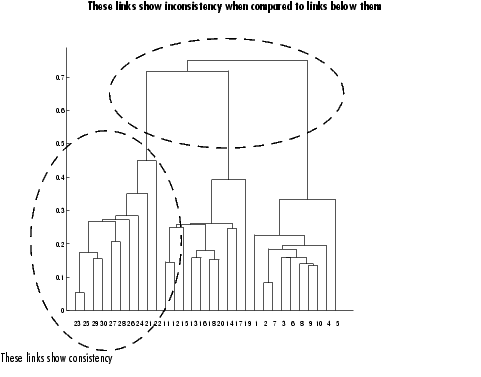
Example: Inconsistent Links. To illustrate, the following example creates a data set of random numbers with three deliberate natural groupings. In the dendrogram, note how the objects tend to collect into three groups. These three groups are then connected by three longer links. These longer links are inconsistent when compared with the links below them in the hierarchy.
rand('seed',3)
X = [rand(10,2)+1;rand(10,2)+2;rand(10,2)+3];
Y = pdist(X);
Z = linkage(Y);
dendrogram(Z);
The relative consistency of each link in a hierarchical cluster tree can be quantified and expressed as the inconsistency coefficient. This value compares the height of a link in a cluster hierarchy with the average height of neighboring links. If the object is consistent with those around it, it will have a low inconsistency coefficient. If the object is inconsistent with those around it, it will have a higher inconsistency coefficient.
To generate a listing of the inconsistency coefficient for each link the cluster tree, use the inconsistent function. The inconsistent function compares each link in the cluster hierarchy with adjacent links two levels below it in the cluster hierarchy. This is called the depth of the comparison. Using the inconsistent function, you can specify other depths. The objects at the bottom of the cluster tree, called leaf nodes, that have no further objects below them, have an inconsistency coefficient of zero.
For example, returning to the sample data set of x and y coordinates, we can use the inconsistent function to calculate the inconsistency values for the links created by the linkage function, described in Defining the Links Between Objects.
I = inconsistent(Z)
I =
    1.0000         0    1.0000         0
    1.0000         0    1.0000         0
    1.3539    0.8668    3.0000    0.8165
    2.2808    0.3100    2.0000    0.7071
The inconsistent function returns data about the links in an (m-1)-by-4 matrix where each column provides data about the links.
In the sample output, the first row represents the link between objects 1 and 3. (This cluster is assigned the index 6 by the linkage function.) Because this a leaf node, the inconsistency coefficient is zero. The second row represents the link between objects 4 and 5, also a leaf node. (This cluster is assigned the index 7 by the linkage function.)
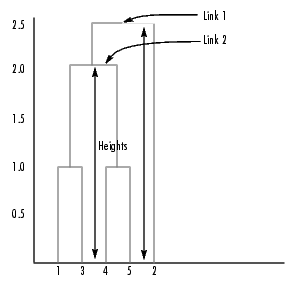
The third row evaluates the link that connects these two leaf nodes, objects 6 and 7. (This cluster is called object 8 in the linkage output). Column three indicates that three links are considered in the calculation: the link itself and the two links directly below it in the hierarchy. Column one represents the mean of the heights of these links. The inconsistent function uses the height information output by the linkage function to calculate the mean. Column two represents the standard deviation between the links. The last column contains the inconsistency value for these links, 0.8165.
The following figure illustrates the links and heights included in this calculation.
Row four in the output matrix describes the link between object 8 and object 2. Column three indicates that two links are included in this calculation: the link itself and the link directly below it in the hierarchy. The inconsistency coefficient for this link is 0.7071.
The following figure illustrates the links and heights included in this calculation.
Creating Clusters
After you create the hierarchical tree of binary clusters, you can divide the hierarchy into larger clusters using the cluster function. The cluster function lets you create clusters in two ways, as discussed in the following sections:
Finding the Natural Divisions in the Data Set. In the hierarchical cluster tree, the data set may naturally align itself into clusters. This can be particularly evident in a dendrogram diagram where groups of objects are densely packed in certain areas and not in others. The inconsistency coefficient of the links in the cluster tree can identify these points where the similarities between objects change. (See Evaluating Cluster Formation for more information about the inconsistency coefficient.) You can use this value to determine where the cluster function draws cluster boundaries.
For example, if you use the cluster function to group the sample data set into clusters, specifying an inconsistency coefficient threshold of 0.9 as the value of the cutoff argument, the cluster function groups all the objects in the sample data set into one cluster. In this case, none of the links in the cluster hierarchy had an inconsistency coefficient greater than 0.9.
The cluster function outputs a vector, T, that is the same size as the original data set. Each element in this vector contains the number of the cluster into which the corresponding object from the original data set was placed.
If you lower the inconsistency coefficient threshold to 0.8, the cluster function divides the sample data set into three separate clusters.
This output indicates that objects 1 and 3 were placed in cluster 1, objects 4 and 5 were placed in cluster 2, and object 2 was placed in cluster 3.
Specifying Arbitrary Clusters. Instead of letting the cluster function create clusters determined by the natural divisions in the data set, you can specify the number of clusters you want created. In this case, the value of the cutoff argument specifies the point in the cluster hierarchy at which to create the clusters.
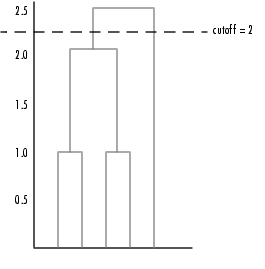
For example, you can specify that you want the cluster function to divide the sample data set into two clusters. In this case, the cluster function creates one cluster containing objects 1, 3, 4, and 5 and another cluster containing object 2.
To help you visualize how the cluster function determines how to create these clusters, the following figure shows the dendrogram of the hierarchical cluster tree. When you specify a value of 2, the cluster function draws an imaginary horizontal line across the dendrogram that bisects two vertical lines. All the objects below the line belong to one of these two clusters.
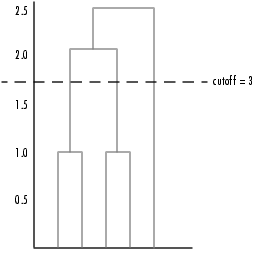
If you specify a cutoff value of 3, the cluster function cuts off the hierarchy at a lower point, bisecting three lines.
This time, objects 1 and 3 are grouped in a cluster, objects 4 and 5 are grouped in a cluster, and object 2 is placed into a cluster, as seen in the following figure.
| | Cluster Analysis | K-Means Clustering | |