
| Printing and Exporting Figures with MATLAB |   |
Getting the Best Results with Black-and-White Printers
If your figure contains line plots and you use the default printer driver, your lines all print in black (or white). This can make it difficult to distinguish one data set from another.
There are two ways make the lines look different from one another:
Example - Setting Line Color and Styles for Printing on a Black and White Printer
By default, MATLAB sets the colors of lines according to the current setting of the ColorOrder property and uses the LineStyleOrder to set the linestyle. The ColorOrder property holds six colors defined as RGB triplets. The factory default for LineStyleOrder is a single style (a solid line).
To distinguish lines, MATLAB cycles first through the ColorOrder values and then the LineStyleOrder values. This means that by default, MATLAB uses different colors but the same line style for all lines.
As an alternative, you can change ColorOrder to a single color, and LineStyleOrder to multiple styles. This example creates a line plot, sets the color for all lines to black, and defines different line styles.
x = -pi:pi/30:pi;
figure('DefaultAxesColorOrder',[0 0 0], ...
'DefaultAxesLineStyleOrder','-|:|--|-.')
plot(x,sin(x),x,cos(x))
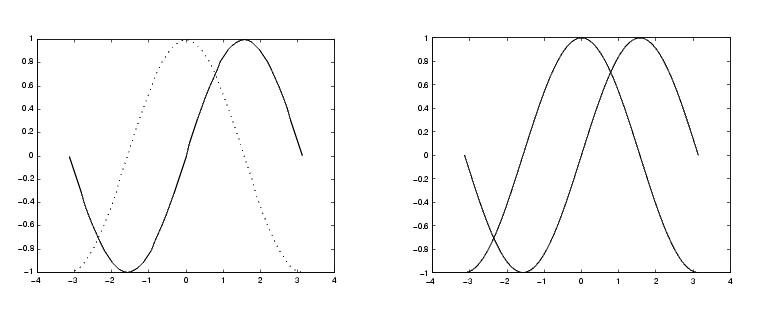
The figure below shows the resulting plot printed on a black-and-white printer and how it would look if you had used the default settings.

Figure 3-3: Plot Printed on Black and White Printer With Line Styles (Left) and Without (Right)
Changing Line Styles with User Interface
You can also use the Property Editor dialog box to individually set the color and styles of lines. See Editing Object Properties.
Adding Marker Symbols to Lines
To further distinguish lines in a figure, you can also add marker symbols. See Colors, Line Styles, and Markers for more information.
 | Default Settings for Colored Lines and Text | Windows 95 and 98 Limitation for Broken Line Styles |  |