| Graphics | |
Using the Data Statistics Tool
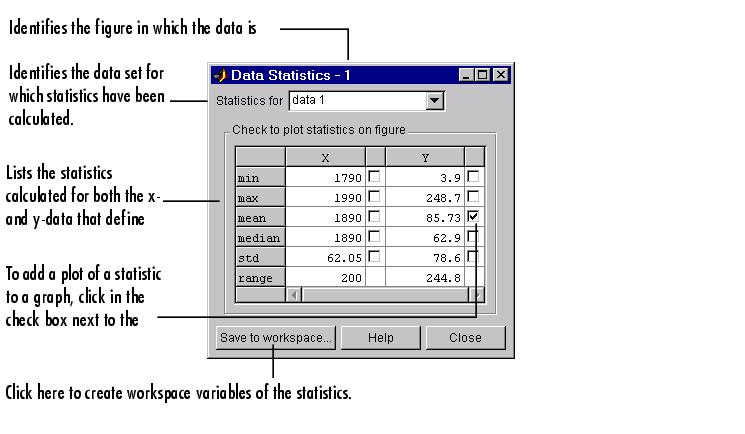
When you select Data Statistics from the MATLAB figure window Tools menu, MATLAB calculates the statistics for each data set plotted in the graph and displays the results in the Data Statistics dialog box.
Adding Plots of Statistics to a Graph
To plot a statistic in a graph, click in the check box next to its value. Adding Plots of Data Statistics to a Graph in the "Formatting Graphs" chapter provides an example of using the Data Statistics tool.
Saving Statistics to the Workspace
To save a set of statistics as a workspace variable, click on the Save to workspace... button. The Data Statistics tool saves the statistics as a structure.
| | Applying Your Changes | Basic Plotting | |