

| System Identification Toolbox | |
Parametric Models: idmodel and its children
idmodel is an object that the user does not deal with directly. It contains all the common properties of the model objects idarx, idgrey, idpoly, and idss, which are returned by the different estimation routines.
Basic Use
If you just estimate models from data, the model objects should be transparent. All parametric estimation routines return idmodel results.
The model m contains all relevant information. Just typing m will give a brief account of the model. present(m) also gives information about the uncertainties of the estimated parameters. get(m) gives a complete list of model properties.
Most of the interesting properties can be directly accessed by subreferencing.
See the property list obtained by get(m), as well as the property lists of idgrey, idarx, idpoly, and idss in the "Command Reference" for more details on this.
The characteristics of the model m can be directly examined and displayed by commands like impulse, step, bode, nyquist, pzmap. The quality of the model is assessed by commands like compare, and resid. If you have the Control System Toolbox, just typing view(m) gives access to various display functions. More details about this will be given below.
To extract state-space matrices, transfer function polynomials, etc., there are the commands
and by idfrd and freqresp, the frequency response of the model can be computed.
Simulation and Prediction
Any idmodel m can be simulated with
where Data is an iddata object with just input channels.
The number of input channels must either be equal to the number of measured channels in m, in which case a noise free simulation is obtained, or equal to the sum of the number of input and output channels in m. In the latter case the last input signals (v) are interpreted as white noise. They are then scaled by the NoiseVariance matrix of m and added to the output via the disturbance model


where the matrix L is given from the noise covariance  by
by .
.
The output is returned as an iddata object with just output channels. Here is a typical string of commands.
A = [1 -1.5 0.7];
B = [0 1 0.5];
m0 = idpoly(A,B,[1 -1 0.2]);
u = iddata([],idinput(400,'rbs',[0 0.3]));
v= iddata([],randn(400,1));
y = sim(m0, [u v]);
plot(y)
The "inverse model" (3-38), which computes the prediction errors from given input-output data, is simulated with
To compute the k-step ahead prediction of the output signal based on a model m, the procedure is as follows.
The predicted value  is computed using the information in
  up to time
  and information in
  up to time
  . The actual way that the information in past outputs is used depends on the disturbance model in
 m. For example, an output error model (that is, H = 1 in (3-10) maintains that there is no information in past outputs, therefore, predictions and simulations coincide.
predict can evaluate how well a time-series model is capable of predicting future values of the data. Here is an example, where y is the original series of, say, monthly sales figures. A model is estimated based on the first half, and then its ability to predict half a year ahead is checked out on the second half of the observations.
The command compare is useful for any comparisons involving sim and predict.
Dealing with Input and Output Channels
For multivariable models, you construct submodels containing a subset of inputs and outputs by simple subreferencing. The outputs and input channels can be referenced according to
Use colon (:) to denote all channels and the empty matrix ([ ]) to denote no channels. The channels can be referenced by number or by name. For several names, a cell array must be used.
Thus m3 is the model obtained from m by considering the transfer functions from input numbers 1 and 4 (with input names 'power' and 'speed') to output number 3 (with name 'position')
will select the corresponding input channels, and for a single input model
will select the indicated output channels.
Subreferencing is quite useful, e.g., when a plot of just some channels is desired.
The Noise Channels
The estimated models have two kinds of input channels: the measured inputs u and the noise inputs e. For a general linear model m, we have
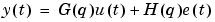
|
(3-53) |
where u is the nu-dimensional vector of measured input channels and e is the ny-dimensional vector of noise channels. The covariance matrix of e is given by the property 'NoiseVariance'. Occasionally this matrix  will be written in factored form

This means that e can be written as

where v is white noise with identity covariance matrix (independent noise sources with unit variances).
If m is a time series (nu = 0), G is empty and the model is given by
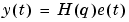
|
(3-54) |
For the model m in (3-53), the restriction to the transfer function matrix G is obtained by
Then e is set to 0 and H is removed.
creates a time-series model m2 from m by ignoring the measured input. That is m2 is given by (3-54).
For a system with measured inputs, bode, step, and many other transformation and display functions just deal with the transfer function matrix G. To obtain or graph the properties of the disturbance model H, it is therefore important to make the transformations m('n'). For example,
will plot the additive noise spectra according to the model m, while
just plots the frequency responses of G.
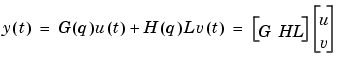
To study the noise contributions in more detail, it may be useful to convert the noise channels to measured channels, using the command noisecnv:
This creates a model m3 with all input channels, both measured u and noise sources e, being treated as measured signals,. That is, m3 is a model from u and e to y, describing the transfer functions G and H. The information about the variance of the innovations e is then lost. For example, studying the step response from the noise channels, will then not take into consideration how large the noise contributions actually are.
To include that information, e should first be normalized  , so that
  becomes white noise with an identity covariance matrix.
This will create a model m4 with  and
and  treated as measured signals.
For example, the step responses from v to y will now also reflect the typical size of the disturbance influence, due to the scaling by L. In both these cases, the previous noise sources, that have become regular inputs will automatically get input names that are related to the corresponding output. The unnormalized noise sources e have names like 'e@y1' (noise e at output channel with name y1), while the normalized sources v are called 'v@y1'.
Retrieving Transfer Functions
The functions that retrieve transfer function properties, ssdata, tfdata, and zpkdata will thus work as follows for a model (3-53) with measured inputs: (fcn is any of ssdata, tfdata, or zpkdata).
fcn(m) returns the properties of G (ny outputs and nu inputs)
fcn(m('n')) returns the properties of the transfer function H (ny outputs and ny inputs)
fcn(noisecnv(m)) returns the properties of the transfer function [G H] (ny outputs and ny+nu inputs).
fcn(noisecnv(m,'Norm')) returns the properties of the transfer function
[G HL} (ny outputs and ny+nu inputs. Analogously
returns the properties of the transfer function HL. (ny outputs and ny inputs).
If m is a time series model, fcn(m) returns the properties of H , while
Note that the estimated covariance matrix NoiseVariance itself is uncertain. This means that the uncertainty information about H is different from that of HL.
idmodel Properties
See Function Reference for a complete list of idmodel properties.
Adding Channels
creates an idmodel object m, consisting of all the input channels in m1,... mN. The output channels of mk must be the same. Analogously
creates an idmodel object m consisting of all the output channels in m1, m2,..., mN. The input channels of mk must all be the same.
If you have the Control System Toolbox, interconnections between idmodels, like G1+G2, G1*G2, append(G1,G2), feedback(G1,G2), etc, can be performed just as for LTI-objects. However, covariance information is typically lost.
| | Examining Models | Frequency Function Format: the idfrd model | |