
| Customization |   |
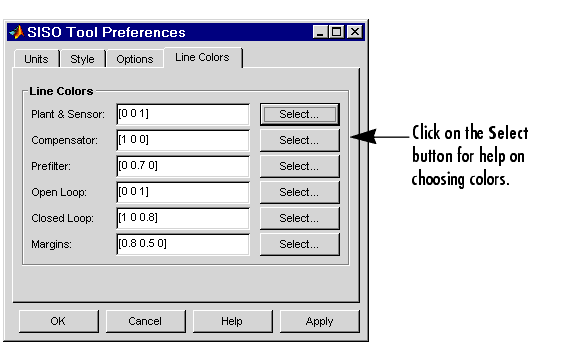
The Line Colors page, shown below, has selections for specify the colors of the lines in the response plots of the SISO Design Tool.
To change the colors of plot lines associated with parts of your model, specify a three-element vector to represent red, green, and blue (RGB) values. Vector element values can range from 0 to 1.
If you do not want to specify the RGB values numerically, press the Select button to open the Select Colors window. See Select colors for more information.
 | Options Page | Customizing Response Plot Properties |  |