
| Customization |   |
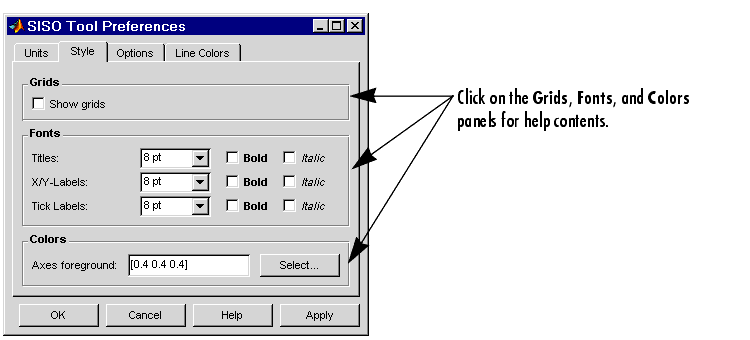
Use the Style page to toggle grid visibility and set font preferences and axes foreground colors for all plots in the SISO Design Tool. This figure shows the Style page.
Grids Panel
Check the box to activate grids for all plots in the SISO Design Tool
Fonts Panel
Set the font size, weight (bold), and angle (italic) by using the menus and checkboxes.
Colors Panel
Specify the color vector to use for the axes foreground, which includes the X-Y axes, grid lines, and tick labels. Use a three-element vector to represent red, green, and blue (RGB) values. Vector element values can range from 0 to 1.
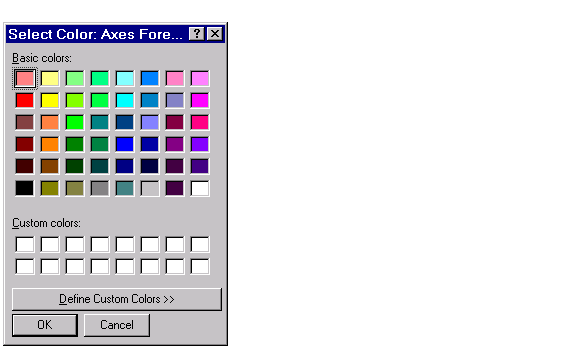
Select colors. Press the Select button to open the Select Color window for the axes foreground.

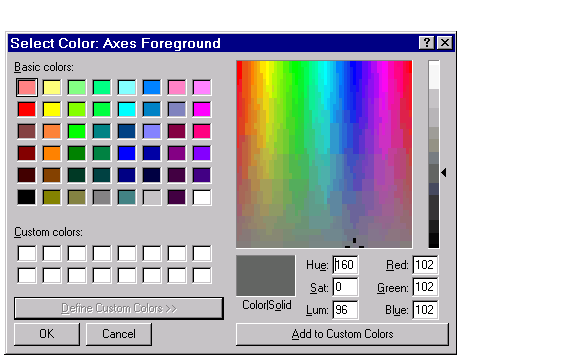
You can use this window to choose axes foreground colors without having to set RGB (red-green-blue) values numerically. To make your selections, click on the colored rectangles and press OK. If you want a broader range of colors, press the Define Custom Colors button. This extends the Select Color window, as shown in this figure.

You can pick colors from the color spectrum located in the upper right corner of the window. To select a custom color, follow these steps:
 | Units Page | Options Page |  |