| Statistics Toolbox | |
Weibull Distribution
The following sections provide an overview of the Weibull distribution.
Background of the Weibull Distribution
Waloddi Weibull (1939) offered the distribution that bears his name as an appropriate analytical tool for modeling the breaking strength of materials. Current usage also includes reliability and lifetime modeling. The Weibull distribution is more flexible than the exponential for these purposes.
To see why, consider the hazard rate function (instantaneous failure rate). If f(t) and F(t) are the pdf and cdf of a distribution, then the hazard rate is

Substituting the pdf and cdf of the exponential distribution for f(t) and F(t) above yields a constant. The example below shows that the hazard rate for the Weibull distribution can vary.
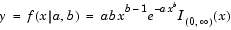
Definition of the Weibull Distribution
Parameter Estimation for the Weibull Distribution
Suppose we want to model the tensile strength of a thin filament using the Weibull distribution. The function weibfit gives MLEs and confidence intervals for the Weibull parameters.
strength = weibrnd(0.5,2,100,1);       % Simulated strengths.
[p,ci] = weibfit(strength)
p =
    0.4746    1.9582
ci =
    0.3851    1.6598
    0.5641    2.2565
The default 95% confidence interval for each parameter contains the true value.
Example and Plot of the Weibull Distribution
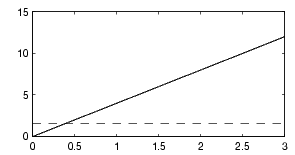
The exponential distribution has a constant hazard function, which is not generally the case for the Weibull distribution.
The plot shows the hazard functions for exponential (dashed line) and Weibull (solid line) distributions having the same mean life. The Weibull hazard rate here increases with age (a reasonable assumption).
t = 0:0.1:3;
h1 = exppdf(t,0.6267) ./ (1-expcdf(t,0.6267));
h2 = weibpdf(t,2,2) ./ (1-weibcdf(t,2,2));
plot(t,h1,'--',t,h2,'-')
| | Noncentral t Distribution | Descriptive Statistics | |