

| Statistics Toolbox | |
Hypothesis Test Assumptions
The difference between hypothesis test procedures often arises from differences in the assumptions that the researcher is willing to make about the data sample. For example, the Z-test assumes that the data represents independent samples from the same normal distribution and that you know the standard deviation,  . The t-test has the same assumptions except that you estimate the standard deviation using the data instead of specifying it as a known quantity.
Both tests have an associated signal-to-noise ratio
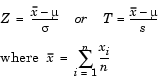
The signal is the difference between the average and the hypothesized mean. The noise is the standard deviation posited or estimated.
If the null hypothesis is true, then Z has a standard normal distribution, N(0,1). T has a Student's t distribution with the degrees of freedom,  , equal to one less than the number of data values.
Given the observed result for Z or T, and knowing the distribution of Z and T assuming the null hypothesis is true, it is possible to compute the probability (p-value) of observing this result. A very small p-value casts doubt on the truth of the null hypothesis. For example, suppose that the p-value was 0.001, meaning that the probability of observing the given Z or T was one in a thousand. That should make you skeptical enough about the null hypothesis that you reject it rather than believe that your result was just a lucky 999 to 1 shot.
There are also nonparametric tests that do not even require the assumption that the data come from a normal distribution. In addition, there are functions for testing whether the normal assumption is reasonable.
| | Hypothesis Test Terminology | Example: Hypothesis Testing | |