| Stateflow |
  |
Stateflow Debugger User Interface
This section contains the following topics:
- Debugger Main Window -- Shows you the parts of the Debugger window.
- Status Display Area -- Lists and describes the items displayed in the Status Display Area of the Debugger window when a breakpoint is encountered during simulation.
- Breakpoint Controls -- Lists and describes breakpoints that you can set while simulating your application.
- Debugger Action Control Buttons -- Describes the control buttons that you can use to control execution during simulation before and after breakpoints are encountered.
- Animation Controls -- Tells you how you can enable or disable animation of your Stateflow diagram during simulation.
- Display Controls -- Describes the buttons you use during simulation to display information you use to debug your application.
Debugger Main Window
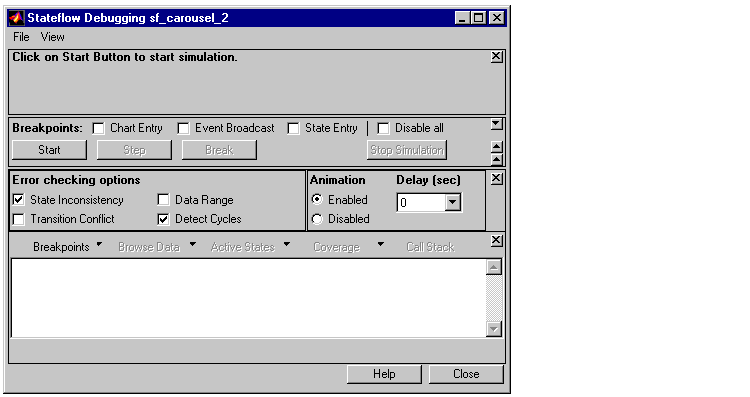
Before you begin debugging, select Debug from the Tools menu to receive the Debugger main window, which appears as shown:
After you select the Start button to start a debugging simulation session and a breakpoint that you set is encountered, the Debugger main window appears like the following:
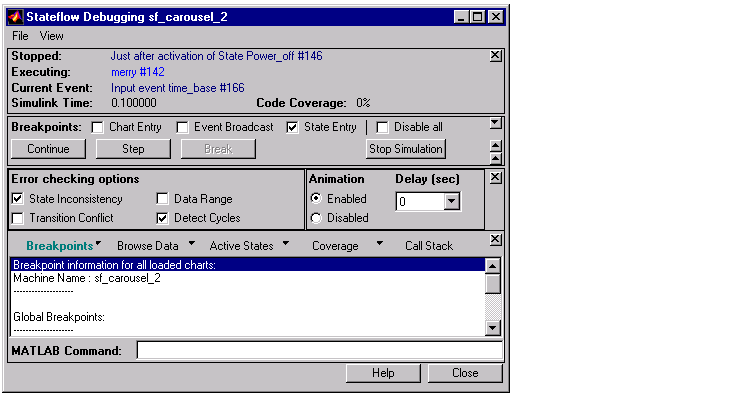
Status Display Area
Once a debugging session is in progress and a breakpoint is encountered, the following status items are displayed in the upper portion of the Debugger window:
- The currently executing model is displayed in the Executing field.
- The execution point that the Debugger is halted at is displayed in the Stopped field.
- Consecutive displays of this field show each semantic step being executed.
- The event being processed is displayed in the Current Event field.
- The current simulation time is displayed in the Simulink Time field.
- The percentage of code that has been covered thus far in the simulation is displayed in the Code Coverage field.
Breakpoint Controls
Use the Breakpoint controls to specify global breakpoints. When a global breakpoint is encountered during simulation, execution stops and the Debugger takes control. Select any or all of the following breakpoints:
- Chart Entry -- Simulation halts on chart entry.
- Event Broadcast -- Simulation halts when an event is broadcast.
- State Entry -- Simulation halts when a state is entered.
These breakpoints can be changed during run-time and are immediately enforced. When you save a Stateflow diagram, the breakpoint settings are saved with it.
Debugger Action Control Buttons
Use these buttons when debugging a Stateflow machine to control the Debugger's actions:
- Start-- Specify that simulation execution proceed until a breakpoint (global or local) is reached. Once the Start button has been clicked, the Stateflow diagram is marked read-only. The appearance of the graphics editor toolbar and menus changes so that object creation is not possible. When the graphics editor is in this read-only mode, its condition is referred to as iced.
- Continue-- After simulation has been started, and a breakpoint has been encountered, the Start button is marked Continue. Press Continue to continue simulation.
- Step -- Single step through the simulation execution.
- Break -- Suspend the simulation and transfer control to the debugger.
- Stop Simulation -- Stop the simulation execution and relinquish debugging control. Once the debug session is stopped, the graphics editor toolbar and menus return to their normal appearance and operation so that object creation is again possible.
| | Run-Time Debugging | | Error Checking Options | |