
| Using Simulink |   |
Viewing Output Trajectories
Output trajectories from Simulink can be plotted using one of three methods:
Using the Scope Block
You can use display output trajectories on a Scope block during a simulation. This simple model shows an example of the use of the Scope block.

The display on the Scope shows the output trajectory. The Scope block enables you to zoom in on an area of interest or save the data to the workspace.
The XY Graph block enables you to plot one signal against another.
Using Return Variables
By returning time and output histories, you can use MATLAB plotting commands to display and annotate the output trajectories.

The block labeled Out is an Outport block from the Signals & Systems library. The output trajectory, yout, is returned by the integration solver. For more information, see The Workspace I/O Pane.
You can also run this simulation from the Simulation menu by specifying variables for the time, output, and states on the Workspace I/O page of the Simulation Parameters dialog box. You can then plot these results using
Using the To Workspace Block
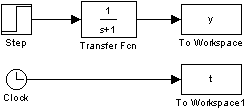
The To Workspace block can be used to return output trajectories to the MATLAB workspace. The model below illustrates this use.

The variables y and t appear in the workspace when the simulation is complete. You store the time vector by feeding a Clock block into a To Workspace block. You can also acquire the time vector by entering a variable name for the time on the Workspace I/O pane of the Simulation Parameters dialog box, for menu-driven simulations, or by returning it using the sim command (see The Workspace I/O Pane for more information).
The To Workspace block can accept an array input, with each input element's trajectory stored in the resulting workspace variable.
 | Analyzing Simulation Results | Linearizing Models |  |