| Image Processing Toolbox | |
Displaying Multiple Images
MATLAB does not place any restrictions on the number of images you can display simultaneously. However, there are usually system limitations that are dependent on the computer hardware you are using. The sections below describe how to display multiple figures separately, or within the same figure.
The main limitation is the number of colors your system can display. This number depends primarily on the number of bits that are used to store the color information for each pixel. Most systems use either 8, 16, or 24 bits per pixel.
If you are using a system with 16 or 24 bits per pixel, you are unlikely to run into any problems, regardless of the number of images you display. However, if your system uses 8 bits per pixel, it can only display a maximum of 256 different colors, and you can therefore quickly run out of color slots if you display multiple images. (Actually, the total number of colors you can display is slightly fewer than 256, because some color slots are reserved for Handle Graphics objects. The operating system usually reserves a few colors as well.)
To determine the number of bits per pixel on your system, enter this command.
See Working with Different Screen Bit Depths for more information.
It also includes information about working around system limitations.
Displaying Each Image in a Separate Figure
The simplest way to display multiple images is to display them in different figure windows. imshow always displays an image in the current figure, so if you display two images in succession, the second image replaces the first image. To avoid replacing the image in the current figure, use the figure command to explicitly create a new empty figure before calling imshow for the next image. For example,
When you use this approach, the figures you create are empty initially.
If you have an 8-bit display, you must make sure that the total number of colormap entries does not exceed 256. For example, if you try to display three images, each having a different colormap with 128 entries, at least one of the images will display with the wrong colors. (If all three images have identical colormaps, there will not be a problem, because only 128 color slots are used.) Remember that intensity images are also displayed using colormaps, so the color slots used by these images count toward the 256-color total.
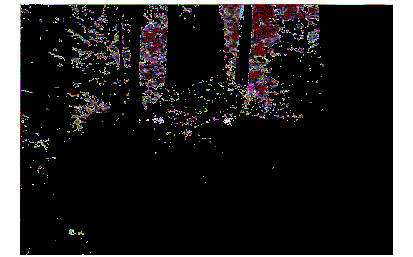
In the next example, two indexed images are displayed on an 8-bit display. Since these images do not have similar colormaps and due to the limitation of the screen color resolution, the first image is forced to use the colormap of the second image, resulting in an inaccurate display.
[X1,map1]=imread('forest.tif');
[X2,map2]=imread('trees.tif');
imshow(X1,map1),figure,imshow(X2,map2);
Figure 3-2: Displaying Two Indexed Images on an 8-bit Screen
As X2 is displayed, X1 is forced to use X2's colormap (and now you can't see the forest for the trees). Note that the actual display results of this example will vary depending on what other application windows are open and using up system color slots.
One way to avoid these display problems is to manipulate the colormaps to use fewer colors. There are various ways to do this, such as using the imapprox function. See Reducing the Number of Colors in an Image for information.
Another solution is to convert images to RGB (truecolor) format for display, because MATLAB automatically uses dithering and color approximation to display these images. Use the ind2rgb function to convert indexed images to RGB.
Or, simply use the cat command to display an intensity image as an RGB image.
Displaying Multiple Images in the Same Figure
You can display multiple images in a single figure window with some limitations. This discussion shows you how to do this in one of two ways:
subplot divides a figure into multiple display regions. The syntax of subplot is
This syntax divides the figure into an m-by-n matrix of display regions and makes the pth display region active.
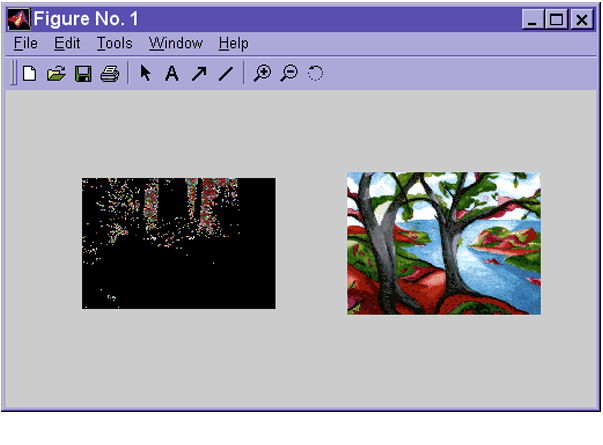
For example, if you want to display two images side by side, use
[X1,map1]=imread('forest.tif');
[X2,map2]=imread('trees.tif');
subplot(1,2,1), imshow(X1,map2)
subplot(1,2,2), imshow(X2,map2)
Figure 3-3: Two Images in Same Figure Using the Same Colormap
If sharing a colormap (using the subplot function) produces unacceptable display results as Figure 3-3 shows, use the subimage function (shown below). Or, as another alternative, you can map all images to the same colormap as you load them. See Colormap Mapping for more information.
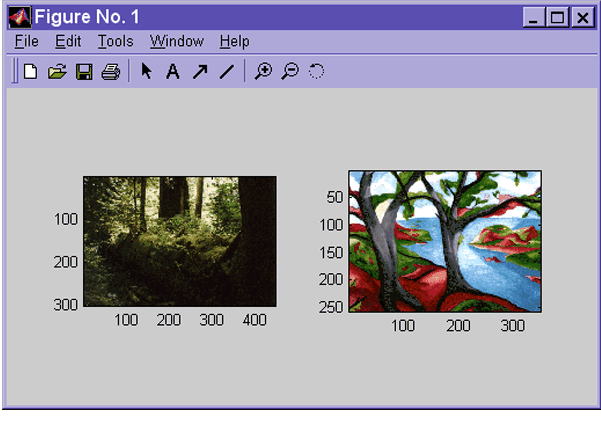
subimage converts images to RGB before displaying and therefore circumvents the colormap sharing problem. This example displays the same two images shown in Figure 3-3 with better results.
[X1,map1]=imread('forest.tif');
[X2,map2]=imread('trees.tif');
subplot(1,2,1), subimage(X1,map1)
subplot(1,2,2), subimage(X2,map2)
Figure 3-4: Two Images in Same Figure Using Separate Colormaps
| | Displaying Multiframe Images | Setting Toolbox Display Preferences | |