
| Image Processing Toolbox |   |
HSV Color Space
The HSV color space (hue, saturation, value) is often used by people who are selecting colors (e.g., of paints or inks) from a color wheel or palette, because it corresponds better to how people experience color than the RGB color space does. The functions rgb2hsv and hsv2rgb convert images between the RGB and HSV color spaces.
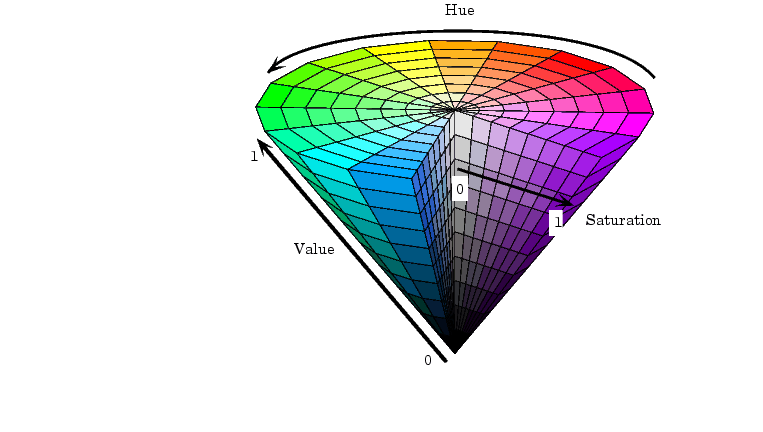
As hue varies from 0 to 1.0, the corresponding colors vary from red, through yellow, green, cyan, blue, and magenta, back to red, so that there are actually red values both at 0 and 1.0. As saturation varies from 0 to 1.0, the corresponding colors (hues) vary from unsaturated (shades of gray) to fully saturated (no white component). As value, or brightness, varies from 0 to 1.0, the corresponding colors become increasingly brighter.
Figure 13-5 illustrates the HSV color space.
Figure 13-5: Illustration of the HSV Color Space
The function rgb2hsv converts colormaps or RGB images to the HSV color space. hsv2rgb performs the reverse operation. These commands convert an RGB image to HSV color space.
For closer inspection of the HSV color space, the next block of code displays the separate color planes (hue, saturation, and value) of an HSV image.
RGB=reshape(ones(64,1)*reshape(jet(64),1,192),[64,64,3]);
HSV=rgb2hsv(RGB);
H=HSV(:,:,1);
S=HSV(:,:,2);
V=HSV(:,:,3);
imshow(H)
figure, imshow(S);
figure, imshow(V);
figure, imshow(RGB);
Figure 13-6: The Separated Color Planes of an HSV Image
The images in Figure 13-6 can be scrutinized for a better understanding of how the HSV color space works. As you can see by looking at the hue plane image, hue values make a nice linear transition from high to low. If you compare the hue plane image against the original image, you can see that shades of deep blue have the highest values, and shades of deep red have the lowest values. (In actuality, there are values of red on both ends of the hue scale, which you can see if you look back at the model of the HSV color space in Figure 13-5. To avoid confusion, our sample image uses only the red values from the beginning of the hue range.) Saturation can be thought of as the purity of a color. As the saturation plane image shows, the colors with the highest saturation have the highest values and are represented as white. In the center of the saturation image, notice the various shades of gray. These correspond to a mixture of colors; the cyans, greens, and yellow shades are mixtures of true colors. Value is roughly equivalent to brightness, and you will notice that the brightest areas of the value plane correspond to the brightest colors in the original image.
 | YCbCr Color Space | Function Reference |  |