

| System Identification Toolbox | |
Syntax
pzmap(m)
pzmap(m,'sd',sd)
pzmap(m1,m2,m3,...)
pzmap(m1,'PlotStyle1',m2,'PlotStyle2',...,'sd',sd)
pzmap(m1,m2,m3,..,'sd',sd,mode,axis)
Description
m is any idmodel object: idarx, idgrey, idss, or idpoly.
The zeros and poles of m are graphed, with o denoting zeros and x denoting poles. Poles and zeros at infinity are ignored. For discrete-time models, zeros and poles at the origin are also ignored.
If sd has a value larger than zero, confidence regions around the poles and zeros are also graphed. The regions corresponding to sd standard deviations are marked. The default value is sd = 0. Note that the confidence regions may sometimes stretch outside the plot, but they are always symmetric around the indicated zero or pole.
If the poles and zeros are associated with a discrete-time model, a unit circle is also drawn. For continuous-time models the real and imaginary axes are drawn
When mi contain information about several different input/output channels, there are some options:
mode = 'sub' splits the screen into several plots, one for each input/output channel. These are based on the InputName and OutputName properties associated with the different models.
mode = 'same' gives all plots in the same diagram. Pressing the Return key advances the plots.
mode = 'sep' erases the previous plot before the next channel pair is treated.
The default value is mode = 'sub'.
axis = [x1 x2 y1 y2] fixes the axis scaling accordingly. axis = s is the same as
The colors associated with the different models can be selected by the arguments PlotStyle. Use PlotStyle = 'b', 'g', etc. Markers and line styles are not used.
The noise input channels in m are treated as follows: Consider a model m with both measured input channels u (nu channels) and noise channels e (ny channels) with covariance matrix 
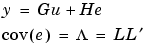
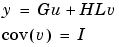
where L is a lower triangular matrix. Note that m.NoiseVariance =  . The model can also be described with unit variance, normalized noise source v
pzmap(m) plots the zeros and poles of the transfer function G.
pzmap(m('n')) plots the zeros and poles of the transfer function H. (ny inputs and ny outputs). The input channels have names e@yname, where yname is the name of the corresponding output.
m is a time series, that is nu = 0, pzmap(m) plots the zeros and poles of the the transfer function H.
pzmap(noisecnv(m)) plots the zeros and poles of the transfer function [G H] (nu+ny inputs and ny outputs). The noise input channels have names e@yname, where yname is the name of the corresponding output.
pzmap(noisecnv(m,'norm')) plots the zeros and poles of the transfer function [G HL] (nu+ny inputs and ny outputs. The noise input channels have names v@yname, where yname is the name of the corresponding output.
Examples
shows all zeros and poles of two models along with the confidence regions corresponding to three standard deviations.
See Also
| | present | rarmax | |