| Financial Toolbox | |
Producing Graphics with the Toolbox
The Financial Toolbox and MATLAB graphics functions work together to produce presentation quality graphics, as these examples show. The examples ship with the toolbox as M-files. Try them by entering the commands directly or by executing the M-files. For help using MATLAB plotting functions, see "Creating Plots" in the MATLAB documentation.
Plotting an Efficient Frontier
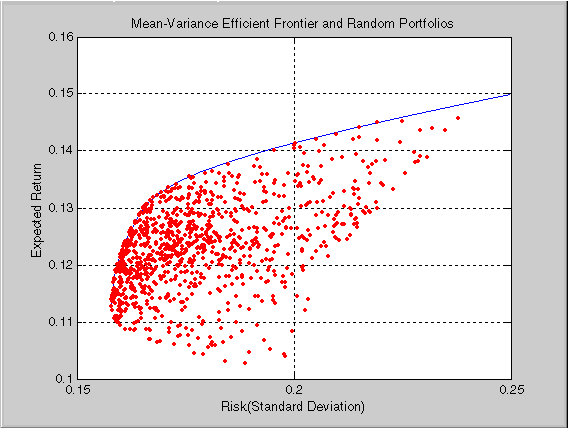
This example plots the efficient frontier of a hypothetical portfolio of three assets. It illustrates how to specify the expected returns, standard deviations, and correlations of a portfolio of assets, how to convert standard deviations and correlations into a covariance matrix, and how to compute and plot the efficient frontier from the returns and covariance matrix. The example also illustrates how to randomly generate a set of portfolio weights, and how to add the random portfolios to an existing plot for comparison with the efficient frontier. The example M-file is ftgex1.m.
First, specify the expected returns, standard deviations, and correlation matrix for a hypothetical portfolio of three assets. Note the symmetry of the correlation matrix.
Returns      = [0.1 0.15 0.12];
STDs         = [0.2 0.25 0.18];

Correlations = [ 1   0.8  0.4
                0.8   1   0.3
                0.4  0.3   1 ];
Convert the standard deviations and correlation matrix into a variance-covariance matrix with the Financial Toolbox function corr2cov.
Evaluate and plot the efficient frontier at 20 points along the frontier, using the function portopt and the expected returns and corresponding covariance matrix. Although rather elaborate constraints can be placed on the assets in a portfolio, for simplicity accept the default constraints and scale the total value of the portfolio to 1 and constrain the weights to be positive (no short-selling).
Now that the efficient frontier is displayed, randomly generate the asset weights for 1000 portfolios starting from the MATLAB initial state.
The previous line of code generates three columns of uniformly distributed random weights, but does not guarantee they sum to 1. The following code segment normalizes the weights of each portfolio so that the total of the three weights represent a valid portfolio.
Total = sum(Weights, 2);     % Add the weights
Total = Total(:,ones(3,1));  % Make size-compatible matrix
Weights = Weights./Total;    % Normalize so sum = 1
Given the 1000 random portfolios just created, compute the expected return and risk of each portfolio associated with the weights.
Finally, hold the current graph, and plot the returns and risks of each portfolio on top of the existing efficient frontier for comparison. After plotting, annotate the graph with a title and return the graph to default holding status (any subsequent plots will erase the existing data). The efficient frontier appears in blue, while the 1000 random portfolios appear as a set of red dots on or below the frontier.
hold on
plot (PortRisk, PortReturn, '.r')
title('Mean-Variance Efficient Frontier and Random Portfolios')
hold off
| | Term Structure Analysis and Interest Rate Swap Pricing | Plotting Sensitivities of an Option | |