
| Getting Started |   |
Comparing Multiple Models
This section shows you how to import and manipulate multiple models in one LTI Viewer. For example, if you have designed a set of compensators to control a system, you can compare the closed-loop step responses and Bode plots using the LTI Viewer.
A sample set of closed-loop transfer function models is included (along with some other models) in the MAT-file ltiexamples.mat. Type
to load the provided transfer functions. The three closed-loop transfer function models, Gcl1, Gcl2, and Gcl3, are for a satellite attitude controller.
In this example, you analyze the response plots of the Gcl1 and Gcl2 transfer functions.
Initializing the LTI Viewer with Multiple Plots
To load the two models Gcl1, and Gcl2 into the LTI Viewer, select Import under the File menu and select the desired models in the LTI Browser. See Importing Models into the LTI Viewer for a description of how to select groups of models. If necessary, you can reconfigure the viewer to display both the step responses and Bode plots of the two systems using the Viewer Configuration dialog box. See Showing Multiple Response Types for a discussion of this feature.
Alternatively, you can open an LTI Viewer with both systems and both the step responses and Bode plots displayed. To do this, type
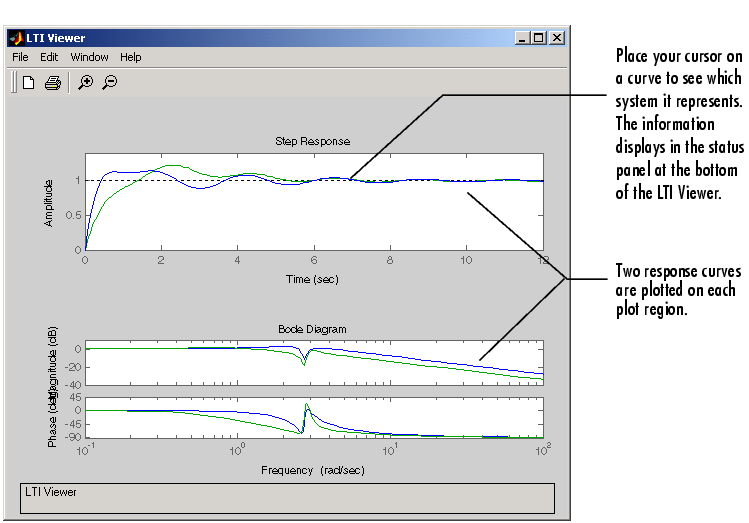
Either approach opens the following LTI Viewer.

Figure 3-10: Multiple Response Plots in a Single LTI Viewer
Inspecting Response Characteristics
To mark the settling time on the step responses presented in this example, do the following:
To mark the stability margins of the Bode plot in this example, open the right-click menu and select Stability Margins (Minimum Crossing) under the Characteristics menu item.
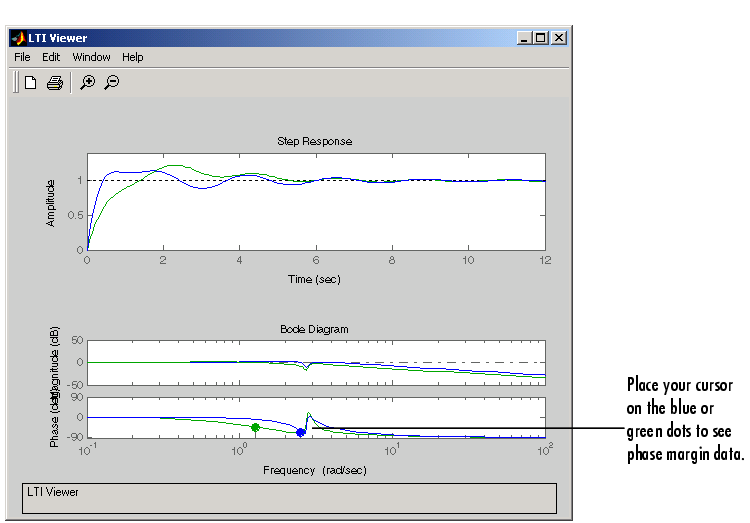
Your LTI Viewer should now look like this.

Figure 3-11: Multiple Plots with Response Characteristics Added
The minimum stability margins, meaning the smallest magnitude phase and gain margins, display as green and blue markers on the Bode phase diagram. If you want to see all the gain and phase margins of a system, select Stability Margins (All Crossings) under the Characteristics menu item.
Toggling Model Visibility
If you have imported more than one model, you can select and clear which models to plot in the LTI Viewer using right-click menus. For example, if you import the following three models into the viewer, you can choose to view any combination of the three you want.
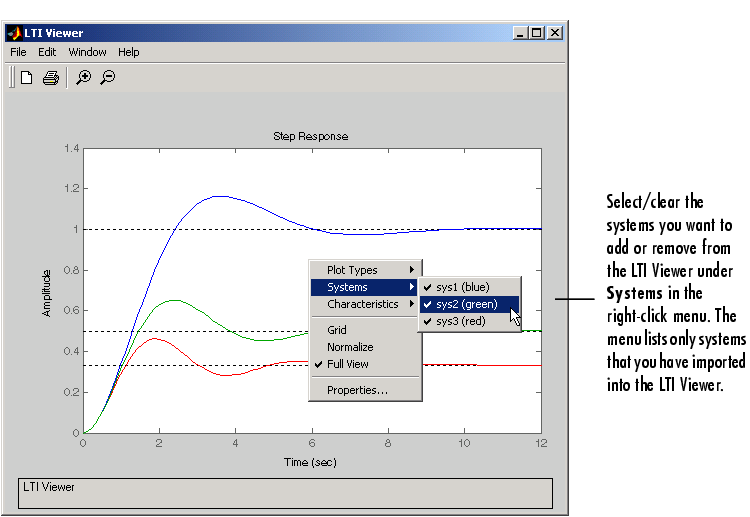
This figure shows how to clear the second of the three models using right-click menu options.

Figure 3-12: Using Right-Click Menus to Select/Clear Plotted Systems
The Systems menu lists all the imported models. A system is selected if a check mark is visible to the left of the system name.
 | Showing Multiple Response Types | Functions for Time and Frequency Response |  |