
| Getting Started |   |
Displaying Response Characteristics on a Plot
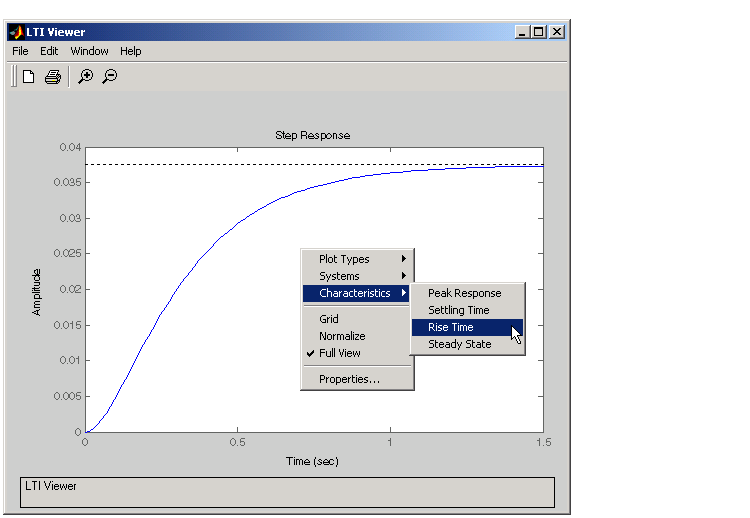
For example, to see the rise time for the DC motor step response, right-click your mouse and select Rise Time under Characteristics, as this figure illustrates.

Figure 3-4: Using Right-Click Menus to Display the Rise Time for a Step Response
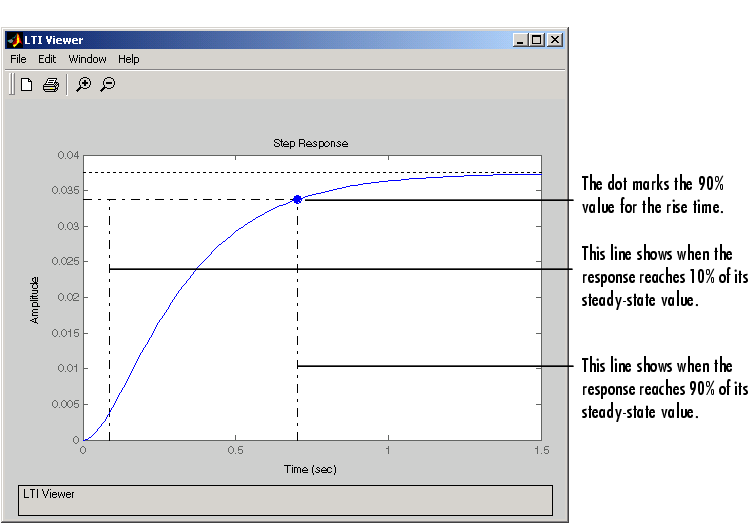
The rise time is defined as the amount of time it takes the step response to go from 10% to 90% of the steady-state value.
The LTI Viewer calculates and displays the rise time for the step response.

Figure 3-5: DC Motor Step Response with the Rise Time Displayed
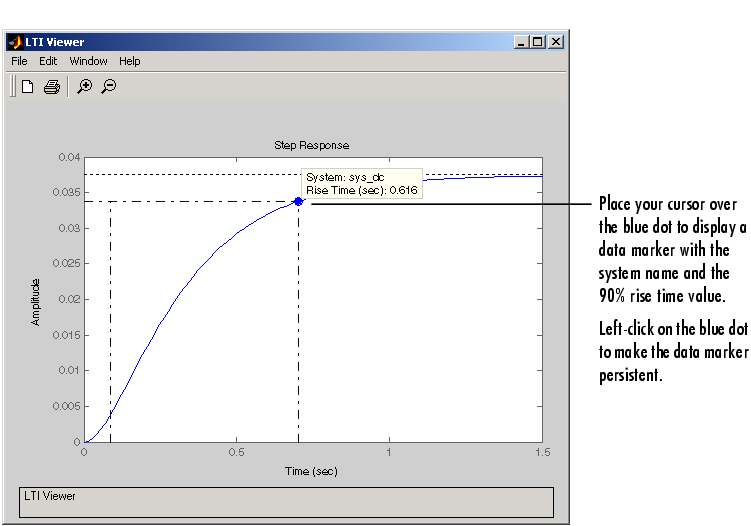
To display the values of any plot characteristic marked on a plot, place your mouse on the blue dot that marks the characteristic. This opens a data marker with the relevant information displayed. To make the marker persistent, left-click on the blue dot.
For example, this figure shows the rise time value for the DC motor step response.

Figure 3-6: Using Your Mouse to Get the Rise Time Values
Note that you can left-click anywhere on a particular plot line to see the response values of that plot at that point. You must either place your cursor over the blue dot or left-click, however, if you want to see the rise time value.
For more information about data markers, see Data Markers.
 | Right-Click Menus | Changing Plot Type |  |