
| Getting Started |   |
Data Markers
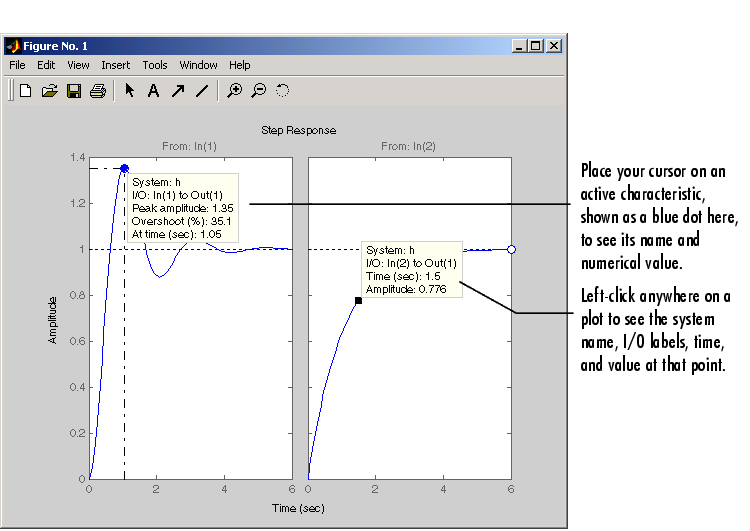
In addition to right-click menus, the Control System Toolbox provides plot data markers. These allow you to identify key data points on your plots. This figure, using the same plot as Figure 3-13, shows markers on the plots.

Figure 3-15: Using Plot Markers to Identify Data Points
You can move a data marker by:
The time and amplitude values will change as you move the marker. This does not apply to markers that display plot characteristics (e.g., peak value or rise time). In the case of plot characteristic data markers, you can view them by placing your cursor over the dot that represents the active characteristic. To make the data marker persistent, left-click on the marker.
| Note Data markers do not apply to the SISO Design Tool, which displays data about plot characteristics in the status panel at the bottom of the SISO Design Tool window. |
Right-Click Menus
Right-click on any data marker to open a property menu for the marker.

Property options for the marker include
Since characteristic data markers are by definition fixed, the right-click menus for them have fewer options.

These options work the same as they do for the full right-click menu.
 | Plotting MIMO Model Responses | Plotting and Comparing Multiple Systems |  |