| MATLAB Function Reference | |
Syntax
Definition
Consider a set of coplanar points  . For each point
  in the set
  , you can draw a boundary enclosing all the intermediate points lying closer to
  than to other points in the set
  . Such a boundary is called a Voronoi polygon, and the set of all Voronoi polygons for a given point set is called a Voronoi diagram.
Description
voronoi(x,y)
plots the bounded cells of the Voronoi diagram for the points x,y. Cells that contain a point at infinity are unbounded and are not plotted.
voronoi(x,y,TRI)
uses the triangulation TRI instead of computing it via delaunay.
voronoi(...,'LineSpec')
plots the diagram with color and line style specified.
h = voronoi(...)
returns, in h, handles to the line objects created.
[vx,vy] = voronoi(...)
returns the finite vertices of the Voronoi edges in vx and vy so that plot(vx,vy,'-',x,y,'.') creates the Voronoi diagram.
Note
For the topology of the Voronoi diagram, i.e., the vertices for each Voronoi cell, use voronoin. [v,c] = voronoin([x(:) y(:)])
|
Visualization
Use one of these methods to plot a Voronoi diagram:
voronoi plots the diagram. See Example 1.
[vx,vy] = voronoi(...). This syntax returns the vertices of the finite Voronoi edges, which you can then plot with the plot function. See Example 2.
voronoin with n = 2 to get the indices of each cell, and then use patch and other plot functions to generate the figure. Note that patch does not fill unbounded cells with color. See Example 3.
Examples
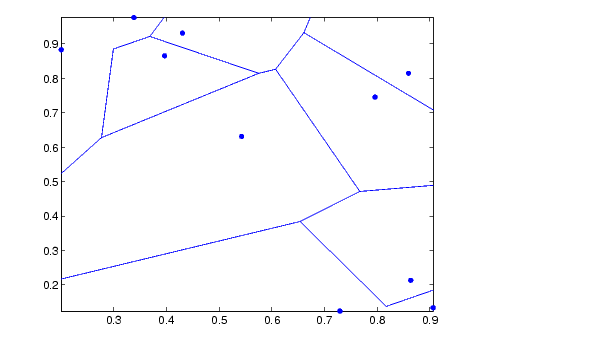
Example 1. This code uses the voronoi function to plot the Voronoi diagram for 10 randomly generated points.
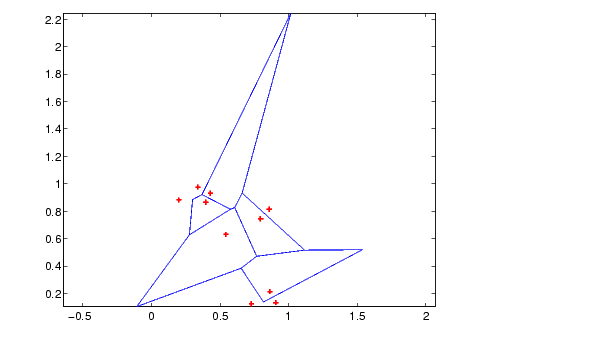
Example 2. This code uses the vertices of the finiteVoronoi edges to plot the Voronoi diagram for the same 10 points.
rand('state',5);
x = rand(1,10); y = rand(1,10);
[vx, vy] = voronoi(x,y);
plot(x,y,'r+',vx,vy,'b-'); axis equal
Note that you can add this code to get the figure shown in Example 1.
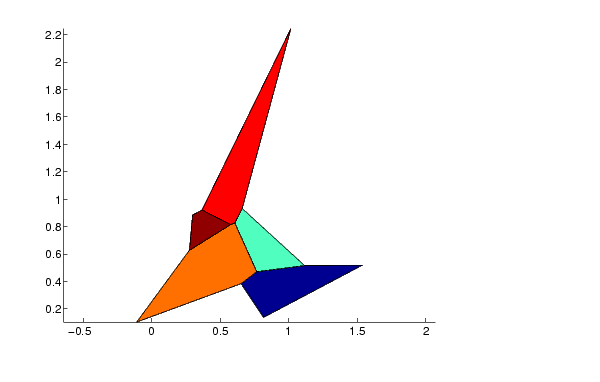
Example 3. This code uses voronoin and patch to fill the bounded cells of the same Voronoi diagram with color.
rand('state',5);
x=rand(10,2);
[v,c]=voronoin(x);
for i = 1:length(c)
if all(c{i}~=1)   % If at least one of the indices is 1,
                  % then it is an open region and we can't
                  % patch that.
patch(v(c{i},1),v(c{i},2),i); % use color i.
end
end
axis equal
Algorithm
If you supply no triangulation TRI, the voronoi function performs a Delaunay triangulation of the data that uses Qhull [2]. This triangulation uses the Qhull joggle option ('QJ'). For information about Qhull, see http://www.geom.umn.edu/software/qhull/. For copyright information, see http://www.geom.umn.edu/software/download/COPYING.html.
See Also
convhull, delaunay, LineSpec, plot, voronoin
Reference
[1] Barber, C. B., D.P. Dobkin, and H.T. Huhdanpaa, "The Quickhull Algorithm for Convex Hulls," ACM Transactions on Mathematical Software, Vol. 22, No. 4, Dec. 1996, p. 469-483. Available in HTML format at http://www.acm.org/ pubs/citations/journals/toms/1996-22-4/p469-barber/ and in PostScript format at ftp://geom.umn.edu/pub/software/qhull-96.ps.
[2] National Science and Technology Research Center for Computation and Visualization of Geometric Structures (The Geometry Center), University of Minnesota. 1993.
| | volumebounds | voronoin | |