| MATLAB Function Reference | |
Syntax
legend('string1','string2',...) legend(h,'string1','string2',...) legend(string_matrix) legend(h,string_matrix) legend(axes_handle,...) legend('off') legend('hide') legend('show') legend('boxoff') legend('boxon') legend(h,...) legend(...,pos) h = legend(...)[legend_h,object_h,plot_h,text_strings] = legend(...)
Description
legend places a legend on various types of graphs (line plots, bar graphs, pie charts, etc.). For each line plotted, the legend shows a sample of the line type, marker symbol, and color beside the text label you specify. When plotting filled areas (patch or surface objects), the legend contains a sample of the face color next to the text label.
legend(' displays a legend in the current axes using the specified strings to label each set of data. string1','string2',...)
legend(h,' displays a legend on the plot containing the handles in the vector string1','string2',...)
h, using the specified strings to label the corresponding graphics object (line, bar, etc.).
legend(string_matrix)
adds a legend containing the rows of the matrix string_matrix as labels. This is the same as legend(string_matrix(1,:),string_matrix(2,:),...).
legend(h,string_matrix)
associates each row of the matrix string_matrix with the corresponding graphics object in the vector h.
legend(axes_handle,...)
displays the legend for the axes specified by axes_handle.
legend('off'),legend(axes_handle,'off')
removes the legend in the current axes or the axes specified by axes_handle.
legend('hide'), legend(axes_handle,'hide')
makes the legend in the current axes or the axes specified by axes_handle invisible.
legend('show'), legend(axes_handle,'show')
makes the legend in the current axes or the axes specified by axes_handle visible.
legend('boxoff'), legend(axes_handle,'boxoff')
removes the box from the legend in the current axes or the axes specified by axes_handle.
legend('boxon'), legend(axes_handle,'boxon')
adds a box to the legend in the current axes or the axes specified by axes_handle.
legend_handle = legend
returns the handle to the legend on the current axes or an empty vector if no legend exists.
legend
with no arguments refreshes all the legends in the current figure.
legend(legend_handle)
refreshes the specified legend.
legend(...,pos)
uses pos to determine where to place the legend.
pos = -1 places the legend outside the axes boundary on the right side.
pos = 0 places the legend inside the axes boundary, obscuring as few points as possible.
pos = 1 places the legend in the upper-right corner of the axes (default).
pos = 2 places the legend in the upper-left corner of the axes.
pos = 3 places the legend in the lower-left corner of the axes.
pos = 4 places the legend in the lower-right corner of the axes.
[legend_h,object_h,plot_h,text_strings] = returns:legend(...)
legend_h - handle of the legend axes
object_h - handles of the line, patch and text graphics objects used in the legend
plot_h - handles of the lines and patches used in the plot
These handles enable you to modify the properties of the respective objects.
Remarks
legend associates strings with the objects in the axes in the same order that they are listed in the axes Children property. By default, the legend annotates the current axes.
MATLAB displays only one legend per axes. legend positions the legend based on a variety of factors, such as what objects the legend obscures.
legend installs a figure ResizeFcn, if there is not already a user-defined ResizeFcn assigned to the figure. This ResizeFcn attempts to keep the legend the same size.
Moving the Legend
You can move the legend by pressing the left mouse button while the cursor is over the legend and dragging the legend to a new location. Double clicking on a label allows you to edit the label.
Examples
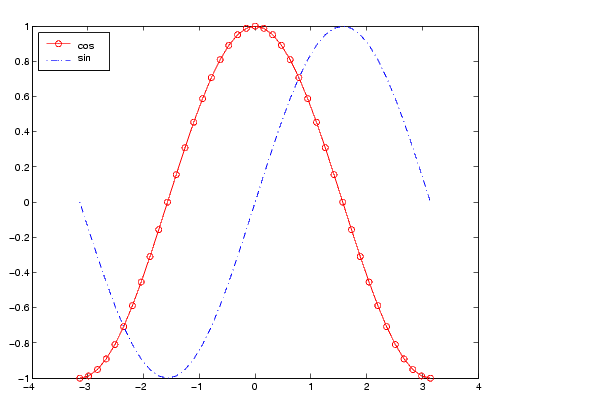
Add a legend to a graph showing a sine and cosine function:
In this example, the plot command specifies a solid, red line ('-r') for the cosine function and a dash-dot, blue line ('-.b') for the sine function.
See Also
Adding a Legend to a Graph for more information on using legends
Annotating Plots for related functions
| | lcm | legendre | |