
| MATLAB Function Reference |   |
Easy to use combination mesh/contour plotter
Syntax
ezmeshc(f)
ezmeshc(f,domain)
ezmeshc(x,y,z)
ezmeshc(x,y,z,[smin,smax,tmin,tmax]) or ezmeshc(x,y,z,[min,max])
ezmeshc(...,n)
ezmeshc(...,'circ')
Description
ezmeshc(f) creates a graph of f(x,y), where f is a string that represents a mathematical function of two variables, such as x and y.
The function f is plotted over the default domain: -2 < x < 2
 , -2
, -2 < y < 2
 . MATLAB chooses the computational grid according to the amount of variation that occurs; if the function f is not defined (singular) for points on the grid, then these points are not plotted.
ezmeshc(f,domain) plots f over the specified domain. domain can be either a 4-by-1 vector [xmin, xmax, ymin, ymax] or a 2-by-1 vector [min, max] (where, min < x < max, min < y < max).
If f is a function of the variables u and v (rather than x and y), then the domain endpoints umin, umax, vmin, and vmax are sorted alphabetically. Thus, ezmeshc('u^2 - v^3',[0,1],[3,6]) plots u2 - v3 over 0 < u < 1, 3 < v < 6.
ezmeshc(x,y,z) plots the parametric surface x = x(s,t), y = y(s,t), and z = z(s,t) over the square: -2 < s < 2
 , -2
, -2 < t < 2
 .
.
ezmeshc(x,y,z,[smin,smax,tmin,tmax]) or ezmeshc(x,y,z,[min,max]) plots the parametric surface using the specified domain.
ezmeshc(...,n) plots f over the default domain using an n-by-n grid. The default value for n is 60.
ezmeshc(...,'circ') plots f over a disk centered on the domain.
Remarks
Array multiplication, division, and exponentiation are always implied in the expression you pass to ezmeshc. For example, the MATLAB syntax for a mesh/contour plot of the expression,
That is, x^2 is interpreted as x.^2 in the string you pass to ezmeshc.
Examples
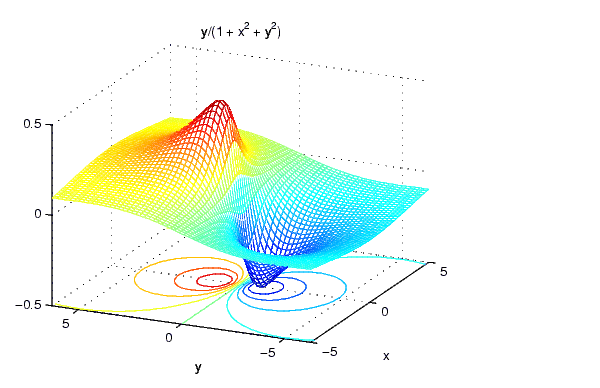
Create a mesh/contour graph of the expression,

over the domain -5 < x < 5, -2*pi < y < 2*pi:
Use the mouse to rotate the axes to better observe the contour lines (this picture uses a view of azimuth = -65.5 and elevation = 26).

See Also
Function Plots for related functions
 | ezmesh | ezplot |  |