
| MATLAB Function Reference |   |
Syntax
axis([xmin xmax ymin ymax])
axis([xmin xmax ymin ymax zmin zmax cmin cmax])
v = axis

axis auto
axis manual
axis tight
axis fill

axis ij
axis xy

axis equal
axis image
axis square
axis vis3d
axis normal

axis off
axis on
Description
axis manipulates commonly used axes properties. (See Algorithm section.)
axis([xmin xmax ymin ymax])
sets the limits for the x- and y-axis of the current axes.
axis([xmin xmax ymin ymax zmin zmax cmin cmax])
sets the x-, y-, and z-axis limits and the color scaling limits (see caxis) of the current axes.
v = axis
returns a row vector containing scaling factors for the x-, y-, and z-axis. v has four or six components depending on whether the current axes is 2-D or 3-D, respectively. The returned values are the current axes' XLim, Ylim, and ZLim properties.
axis auto
sets MATLAB to its default behavior of computing the current axes' limits automatically, based on the minimum and maximum values of x, y, and z data. You can restrict this automatic behavior to a specific axis. For example, axis 'auto x' computes only the x-axis limits automatically; axis 'auto yz' computes the y- and z-axis limits automatically.
axis manual and axis(axis)
freezes the scaling at the current limits, so that if hold is on, subsequent plots use the same limits. This sets the XLimMode, YLimMode, and ZLimMode properties to manual.
axis tight
sets the axis limits to the range of the data.
axis fill
sets the axis limits and PlotBoxAspectRatio so that the axes fill the position rectangle. This option has an effect only if PlotBoxAspectRatioMode or DataAspectRatioMode are manual.
axis ij
places the coordinate system origin in the upper-left corner. The i-axis is vertical, with values increasing from top to bottom. The j-axis is horizontal with values increasing from left to right.
axis xy
draws the graph in the default Cartesian axes format with the coordinate system origin in the lower-left corner. The x-axis is horizontal with values increasing from left to right. The y-axis is vertical with values increasing from bottom to top.
axis equal
sets the aspect ratio so that the data units are the same in every direction. The aspect ratio of the x-, y-, and z-axis is adjusted automatically according to the range of data units in the x, y, and z directions.
axis image
is the same as axis equal except that the plot box fits tightly around the data.
axis square
makes the current axes region square (or cubed when three-dimensional). MATLAB adjusts the x-axis, y-axis, and z-axis so that they have equal lengths and adjusts the increments between data units accordingly.
axis vis3d
freezes aspect ratio properties to enable rotation of 3-D objects and overrides stretch-to-fill.
axis normal
automatically adjusts the aspect ratio of the axes and the relative scaling of the data units so that the plot fits the figures shape as best as possible.
axis off
turns off all axis lines, tick marks, and labels.
axis on
turns on all axis lines, tick marks, and labels.
axis( applies the axes_handles,...)
axis command to the specified axes. For example, the following statements
[mode,visibility,direction] = axis('state')
returns three strings indicating the current setting of axes properties:
| Output Argument |
Strings Returned |
|
|
|
|
|
|
mode is auto if XLimMode, YLimMode, and ZLimMode are all set to auto. If XLimMode, YLimMode, or ZLimMode is manual, mode is manual.
Examples
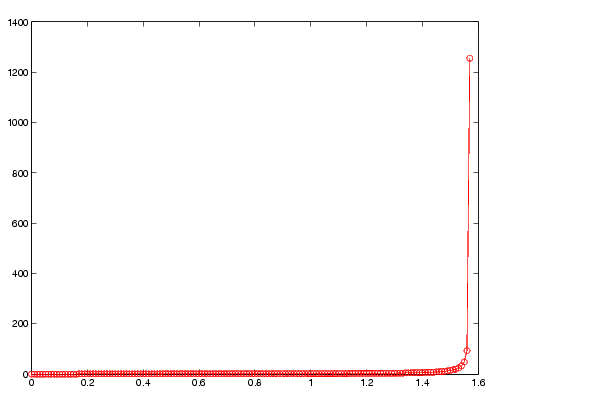
use the automatic scaling of the y-axis based on ymax = tan(1.57), which is well over 1000:

The right figure shows a more satisfactory plot after typing
Algorithm
When you specify minimum and maximum values for the x-, y-, and z-axes, axis sets the XLim, Ylim, and ZLim properties for the current axes to the respective minimum and maximum values in the argument list. Additionally, the XLimMode, YLimMode, and ZLimMode properties for the current axes are set to manual.
axis auto sets the current axes' XLimMode, YLimMode, and ZLimMode properties to 'auto'.
axis manual sets the current axes' XLimMode, YLimMode, and ZLimMode properties to 'manual'.
The following table shows the values of the axes properties set by axis equal, axis normal, axis square, and axis image.
See Also
Properties of axes graphics objects
Axes Operations for related functions
 | Axes Properties | balance |  |