| Programming and Data Types | |
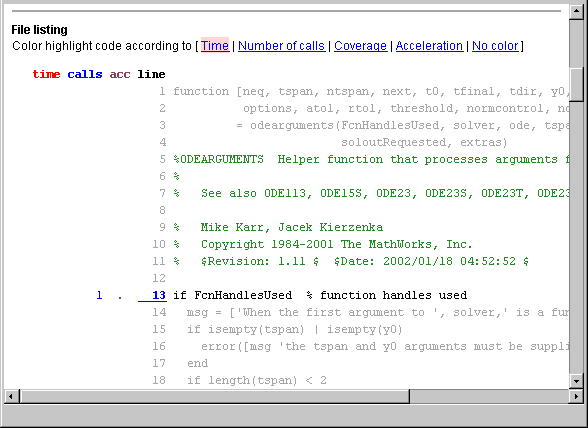
File Listing
The third section lists the file and allows you to highlight lines where the most time was spent, among other options.
Information you can glean from the File listing report includes
Line Colors. Lines are colored as follows. (This is not apparent in the printed documentation.)
| Line Color |
Example |
Description |
| Green |
 |
Comment |
| Black |
 |
Line was executed |
| Gray |
 |
Line was not executed |
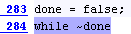
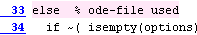
Use the line colors to see which lines of code actually ran. This is useful not only to profile an M-file, but to debug or to see how an M-file works. Color highlighting by coverage, described next, is another way to view this information.
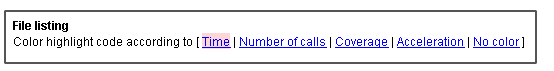
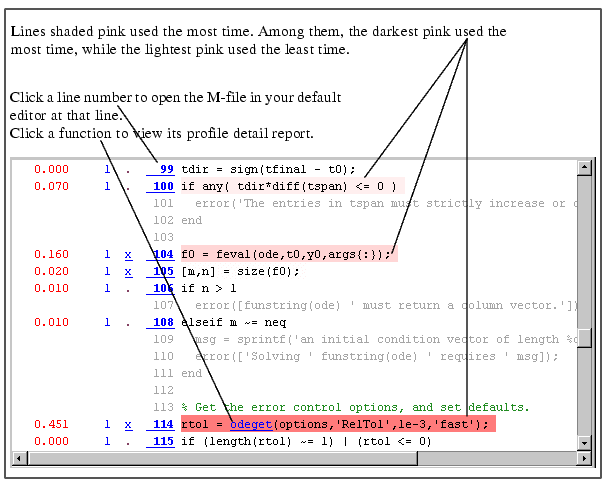
Color Highlighting. In Color highlight code according to, click the type of highlight to change to that view. Time is selected in this example. (Note that Time is shaded pink to indicate it is selected, but that is not apparent in the printed documentation.)
These types of highlighting provide you with another view of the information to help you improve your code. They allow you to scan the report and hone in on areas for improvement at a quick glance. You can then view more details for those lines using the Time, Calls, and Acceleration Columns.
Time, Calls, and Acceleration Columns. For each line of the M-file, there are five columns of information.
| Column |
Value or Example |
Description |
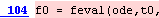
| time |
Total time spent on that line, in seconds. If the line was called but no time is listed, the time was so insignificant that it was not captured. In this example, line 114 ran for .13 seconds. |
|
| calls |
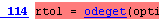
Number of calls to that line. In this example, line 114 was called once. |
|
| acc |
. (dot)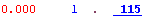 |
A . (dot) indicates the line was accelerated by MATLAB performance acceleration tools. |
x |
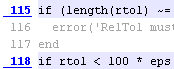
An x indicates the line was not accelerated by MATLAB performance acceleration tools. Click the x to see information about why the line was not accelerated. For details on acceleration, see Performance Acceleration. |
|
| Line Number |
The line number in the M-file. This example shows line 114. Click the line number to open your default editor to that line number. While this is a convenient way to go to a line and modify it in your own M-files, do not modify functions provided with MathWorks products, that is, functions stored in $matlabroot/toolbox directories. |
|
| Code |
The line of code. This example shows part of the line rtol =. Scroll to see more of the line. Click a function to go to its Profiler detail report, for example odeget. |
| | Profile Detail Report | Using Information in the Profiler Reports | |