| Graphics | |
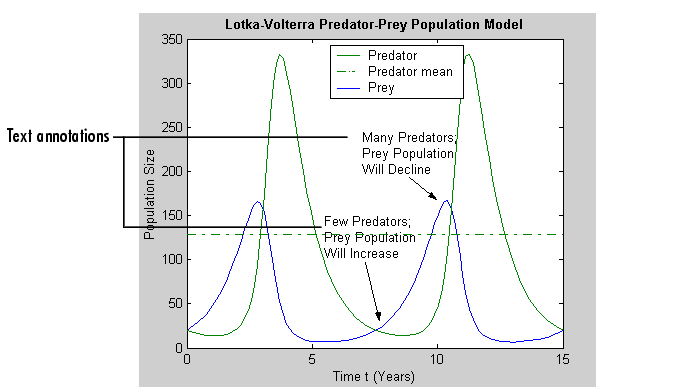
Adding Text Annotations to Graphs
You can add free-form text annotations anywhere in a MATLAB figure to help explain your data or bring attention to specific points in your data sets.
If you enable plot editing mode, you can create text annotations by clicking in an area of the graph or the figure background and entering text. You can also add text annotations from the command line, using the text or gtext command.
Using plot editing mode or gtext make it easy to place a text annotation anywhere in graph. Use the text command when you want to position a text annotation at a specific point in a data set.
| | Adding Axis Labels to Graphs | Creating Text Annotations in Plot Editing Mode | |