| Getting Started |
  |
Plotting MIMO Model Responses
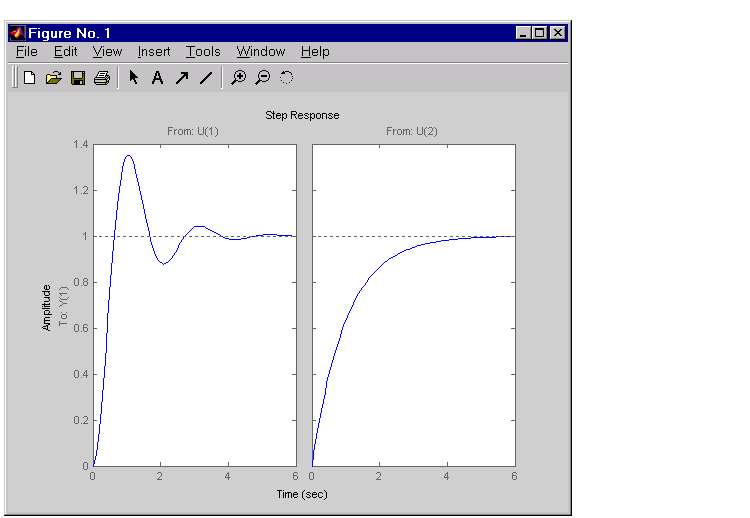
For MIMO models, time and frequency response functions produce an array of plots with one plot per I/O channel (or per output for initial and lsim). For example,
produces the following plot.

Figure 3-13: Step Responses for a MIMO Model
The simulation horizon is automatically determined based on the model dynamics. You can override this automatic mode by specifying a final time,
or a vector of evenly spaced time samples.
Right-Click Menus
All the time and frequency response functions provide right-click menus that allow you to customize your plots. This figure shows the plots from Figure 3-13, Step Responses for a MIMO Model,, with the right-click menu open.

Figure 3-14: Using the Right-Click Menu in a Step Response Plot
The options you can select include
- Systems -- Select or clear any models that you included when you created the response plot.
- Characteristics -- Add information about the plot. The characteristics available change from plot to plot. For example, Bode plots have stability margins available, but step responses have rise time and steady-state values available.
- Axes Grouping -- Change the grouping of your plots. Available options are All, None, Inputs, and Outputs. You can group all the plots together, place each in a separate plot region (none), or group the inputs or outputs together.
- I/O Selector -- Open the I/O Selector Window.

- Use this window to select/clear which inputs and outputs to plot.
- Normalize -- Scale responses to fit the view (only available for time-domain plot types).
- Full View -- Use automatic limits to make the entire curve visible.
- Grid -- Add grids to your plots.
- Properties -- Open the Property Editor, which you can use to customize various attributes of your plot. See Customization in the Control System Toolbox online documentation for a full description of the Property Editor.
- Alternatively, you can open the Property Editor by double-clicking in an empty region of the response plot.
 | Time and Frequency Responses | | Data Markers |  |


