
| Tool and Viewer Reference |   |
Edit
The Edit menu contains the following options:
Plot Configurations Window -- Selecting Response Types
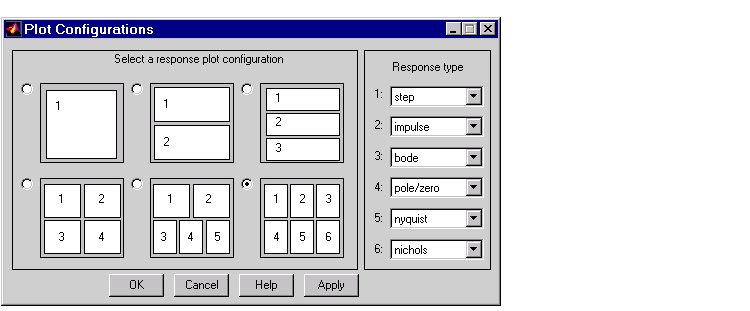
Plot Configuration under the Edit menu opens the Plot Configurations window.

Use this window to select the number and kind of response plots you want in a single instance of the LTI Viewer. You can plot up to six response plots in a single viewer. Click the radio button to the upper left of the configuration you want the viewer to use.
You can select among eight response types for each plot in the viewer. These are the available response types:
Refresh Systems
Refresh updates imported models to reflect any changes made in the MATLAB workspace since you imported them.
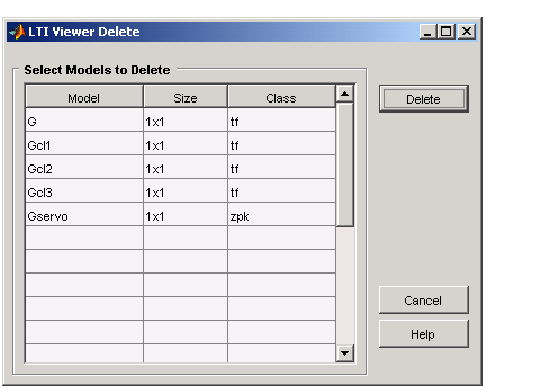
Delete under Systems in the Edit menu opens the LTI Viewer Delete window

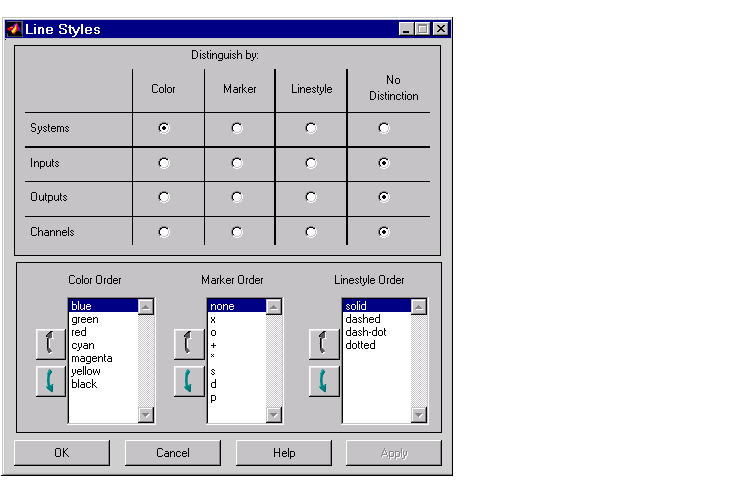
Select Line Styles under the Edit menu to open the Line Styles editor.

The Line Styles editor is particularly useful when you have multiple systems imported. You can use it change line colors, add and rearrange markers, and alter line styes (solid, dashed, and so on).
The Linestyle Preferences window allows you to customize the appearance of the response plots by specifying:
Each LTI Viewer has its own Linestyle Preferences window.
Setting Preferences. You can use the "Distinguish by" matrix to specify the line property that will vary throughout the response plots. You can group multiple plot curves by systems, inputs, outputs, or channels (individual input/output relationships). Note that the Line Styles editor uses radio buttons, which means that you can only assign one property setting for each grouping (system, input, etc.).
Ordering Properties. The Order field allows you to change the default property order used when applying the different line properties. You can reorder the colors, markers, and linestyles (e.g., solid or dashed).
To change any of the property orders, click the up or down arrow button to the left of the associated property list to move the selected property up or down in the list
Viewer Preferences
Viewer Preferences opens the LTI Viewer Preferences editor, which you can use to set response plot defaults for the LTI Viewer that is currently open.
For a complete description of the LTI Viewer Preference editor, as well as all the property and preference editors available in the Control System Toolbox, see Customization in the online Control System Toolbox documentation. To go directly to the LTI Viewer Preferences editor documentation, see LTI Viewer Preferences in the same document.
Window
Use the Window menu to select which of your MATLAB windows is active. This menu lists any window associated with MATLAB and the Control System Toolbox. The MATLAB Command Window is always listed first.
Help
The Help menu links to this help file.
 | File | LTI Viewer Toolbar |  |