SNSim
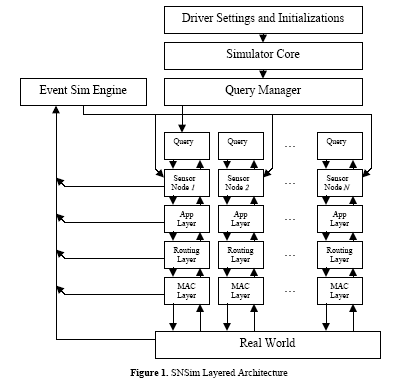
SNSim is a prototype software tool designed to support our research efforts in balancing the lifetime of a wireless sensor network and the quality of data (QoD) that is sampled and processed. Including elements of power consumption characteristics and built to mimic real performances of MICA motes (both in data transfer rate and power consumption - on/off modes), this graphical interface tool is created towards investigating various aspects of development, as well as building applications/simulations for such networks. SNSim is built on top of thejust in time simulation engine(JiST SWANS core has been developed by Cornell University) both of which are written in Java, which offers an enhanced portability and efficiency of development time. SNSim is still a work in progress but has reached already a level of maturity that leads to accurate results from its simulations. Its architecture is summarized in Figure 1, and it follows the typical network layering architecture. The application/simulation setup is mainly realized by writing code in a local scripting language that we call Q-script and it is managed by the Query Manager. From the ground up, this simulator is designed to facilitate in-network interactions through a welldefined and intuitive user interface. The main purpose is to let the user create various situations (both “regular” and “exceptional”) within the network during simulation, and also to allow the researcher to visualize what is happening within the network, starting from real-time routing path visualization to nodes interactions. The system requires more work to be done in the implementation of a concrete Query Manager and the specification of its own Q-script language that is used to program the network instead of individual nodes.

SNSim Experience
The application is built in the NetBeans IDE 3.6 based on Java 2 Platform, Standard Edition (J2SE). It requires JVM to be installed on the working computer prior running it in execution However, JVM is not a standalone application, but is part of J2SE JRE package (we are using version 1.4.2). All these can be downloaded from Sun’s website www.sun.com.
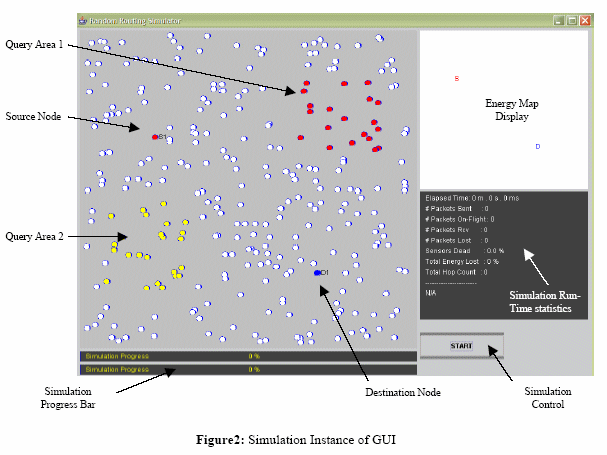
At this time, the main entry in the program is done through RndRoute_Driver.class that contains simulation initialization variables, and that will call the RndRoute_App.class pertaining to each individual sensor node. RndRoute_Driver.class contains both nodes physical parameters (as radio bandwidth, noise levels, battery capacity and energy consumption levels) and logical parameters (routing protocol to be used, MAC protocol, and so on). Available protocols can be refered through constant variables defined in Constants.class You can run the program after you compile it. The application will create independent objects for each node, each routing protocol, run the simulator engine and the FSM logic engine. Also, proper linkage between objects will be made. A graphical user interface will appear and will wait for the user to define Source Nodes, Destination Nodes and Query Areas. The simulator will use these as references from the Q-script. Q-script is a small language that we have designed and implemented to define the scope of the entire network application. The Q-script at this time is must be hardcoded in the RndRoute_Aoo.class before the application is run (we are working on separating and a formal specification of this proprietary Q-script). After all the nodes reference are set, user can mannualy trigger the simulator by pressing “Start” button. It can pause the simulation at any time.
Figure 2 presents an instance of SNSim’s GUI, along with the main components description.

SNSim on the run
We used SNSim to provide quantitative data for testing the benefits of the ( )2 ECA paradigm in
sensor networks settings. The triggers were designed to efficiently process the following user’s
request:
ON E_MovingTowards(O,’R’,5,T)
IF JetsCount(‘B1’, X, T1) AND X < 10 AND T1>=T
within_event(E_MovingTowards(O,’R’,T1))
THEN ALERT(’b’,’A1’)
ELSE
Consumed-by-parent = no, Consume-Parent = no
ON E_Distance(O,’R’,3,T2)
Distance(’Marines’,’R’,X,T2) AND T2>T AND X>=5
THEN ALERT(’a’,’I1’,T2)
- the frequency of changes in the values read by each sensor
- the magnitude of changes in the values read by each sensor
- the polling frequency that the sink uses to query the readings in R2 when the event is detected in R1.
SNSim was run on an Intel Pentium IV CPU 3.8Ghz processor, with 1GB DDR2 memory.

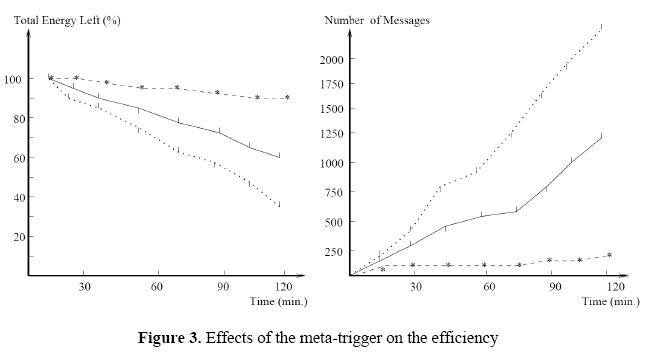
Our network consisted of 400 nodes whose parameters emulated the MICA-motes, and we executed 50 different (R1, R2) pairs, running the simulation for 2 hours for different combinations of the parameters above. Our observations are depicted in Figure 3 where the left potion represents the energy lost in the nodes, and the right portion depicts the number of messages exchanged. The solid line represents the average of all observations operating without the meta-trigger installation in the cluster leaders of R1 and R2, R2 being constantly polled. The dotted line depicts our worst-case observations. However, as indicated with the dashed line, when meta-triggers are used, there is an order of magnitude of savings in the messages exchanged and, conversely, much larger energy savings.
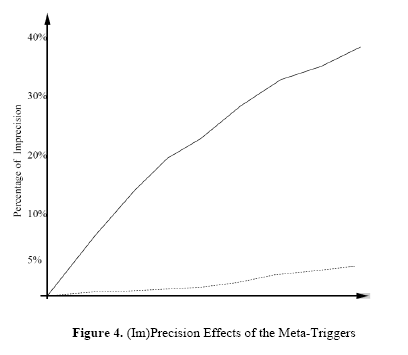
The other set of the experiments was concerned with the (im)precision issues. Namely, if periodic pooling is used, the system may fail to detect changes in the values of the condition (continuous query) if those changes happen fast and in-between two consecutive evaluations. The system may fail to detect the condition even if the meta-trigger is used, but this is only due to a communication delay and in the extreme case when it occurs at the expiration of the enabling event (which is also possible when polling is used). Our results are depicted in Figure 4.

The x-axis denotes the ratio the frequencies of changes in the values that are monitored by individual sensors and their sampling frequency; y-axis is the percentage of misses in detecting that the condition has become true. As can be seen, the imprecision (“misses”) is much higher without a meta-trigger.
Oliviu C. Ghica