| Statistics Toolbox | |
The robustdemo Demo
The robustdemo function presents a simple comparison of least squares and robust fits for a response and a single predictor. You can use robustdemo with your own data or with the sample data provided.
To begin using robustdemo with the built-in sample data, simply type the function name.
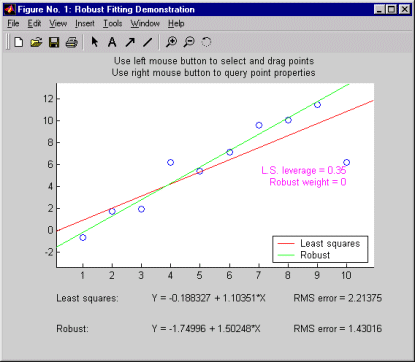
The resulting figure presents a scatter plot with two fitted lines. One line is the fit from an ordinary least squares regression. The other is from a robust regression. Along the bottom of the figure are the equations for the fitted line and the estimated error standard deviation for each fit.
The effect of any point on the least squares fit depends on the residual and leverage for that point. The residual is simply the vertical distance from the point to the line. The leverage is a measure of how far the point is from the center of the X data.
The effect of any point on the robust fit also depends on the weight assigned to the point. Points far from the line get lower weight.
You can use the right mouse button to click on any point and see its least squares leverage and robust weight.
In this example, the rightmost point has a leverage value of 0.35. It is also far from the line, so it exerts a large influence on the least squares fit. It has a small weight, though, so it is effectively excluded from the robust fit.
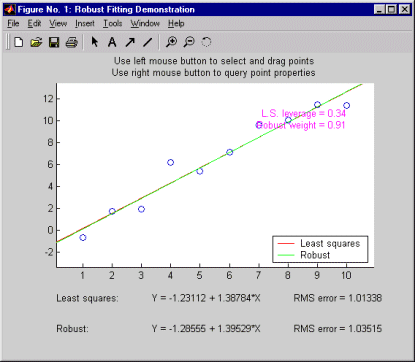
Using the left mouse button, you can experiment to see how changes in the data affect the two fits. Select any point, and drag it to a new location while holding the left button down. When you release the point, both fits update.
Bringing the rightmost point closer to the line makes the two fitted lines nearly identical. Now, the point has nearly full weight in the robust fit.
| | The glmdemo Demo | Reference | |