
| Getting Started |   |
Showing Multiple Response Types
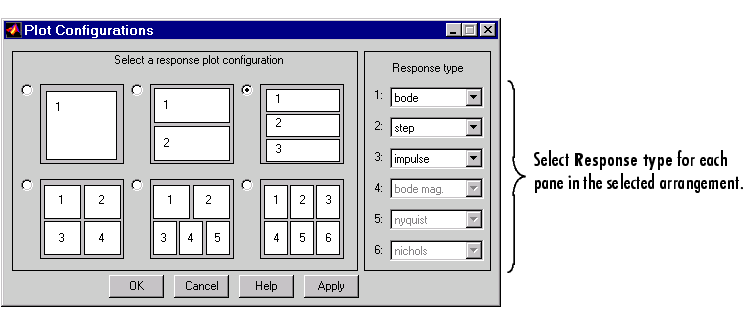
If you want to see, for example, both a step response and a Bode plot at the same time, you have to reconfigure the LTI Viewer. To view different response types in a single LTI Viewer, select Plot Configurations under the Edit menu. This opens the Plot Configurations dialog box.

Figure 3-9: Using the Plot Configurations Dialog Box to Reconfigure the LTI Viewer
You can select up to six plots in one viewer. Choose the Response type for each plot area from the right-hand side menus. There are nine available plot types:
 | Changing Plot Type | Comparing Multiple Models |  |