| Statistics Toolbox | |
Syntax
Description
weibplot(X)
X. If X is a matrix, weibplot displays a plot for each column.
h = weibplot(X)
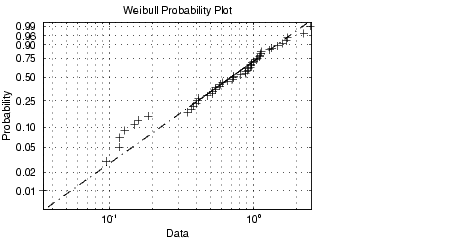
The purpose of a Weibull probability plot is to graphically assess whether the data in X could come from a Weibull distribution. If the data are Weibull the plot will be linear. Other distribution types may introduce curvature in the plot.
Example
See Also
normplot, weibcdf, weibfit, weibinv, weiblike, weibpdf, weibrnd, weibstat
| | weibpdf | weibrnd | |