| Statistics Toolbox | |
Probability Density Estimation
You can also describe a data sample by estimating its density in a nonparametric way. The ksdensity function does this by using a kernel smoothing function and an associated bandwidth to estimate the density.
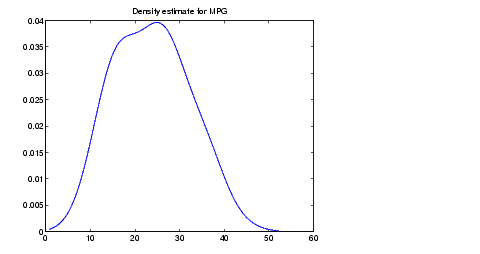
This example uses the carsmall data set to estimate the probability density of the MPG (miles per gallon) measurements for 94 cars. It uses the default kernel function, a normal distribution, and its default bandwidth.
cars = load('carsmall','MPG','Origin');
MPG = cars.MPG;
Origin = cars.Origin;
[f,x] = ksdensity(MPG);
plot(x,f);
title('Density estimate for MPG')
Kernel Bandwidth
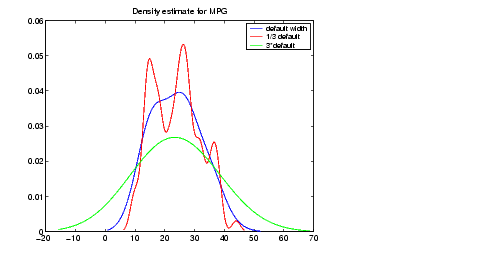
The choice of kernel bandwidth controls the smoothness of the probability density curve. The graph below shows the density estimate for the same mileage data using different bandwidths. The default bandwidth is in blue and looks like the graph above. Estimates for smaller and larger bandwidths are in red and green.
The first call to ksdensity returns the default bandwidth, u, of the kernel smoothing function. Subsequent calls, modify this bandwidth.
[f,x,u] = ksdensity(MPG);
plot(x,f)
title('Density estimate for MPG')
hold on
[f,x] = ksdensity(MPG,'width',u/3);
plot(x,f,'r');
[f,x] = ksdensity(MPG,'width',u*3);
plot(x,f,'g');
legend('default width','1/3 default','3*default')
hold off
The default bandwidth seems to be doing a good job -- reasonably smooth, but not so smooth as to obscure features of the data. This bandwidth is the one that is theoretically optimal for estimating densities for the normal distribution.
The green curve shows a density with the kernel bandwidth set too high. This curve smooths out the data so much that the end result looks just like the kernel function. The red curve has a smaller bandwidth and is rougher-looking than the blue curve. It may be too rough, but it does provide an indication that there may be two major peaks rather than the single peak of the blue curve. A reasonable choice of width might lead to a curve that is intermediate between the red and blue curves.
Kernel Smoothing Function
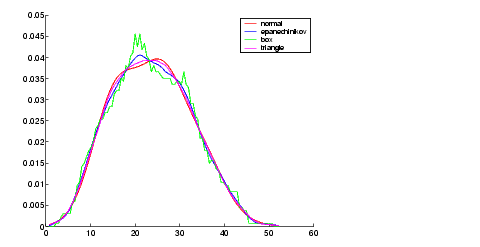
You can also specify a kernel function by supplying either the function name or a function handle. The four pre-selected functions, 'normal', 'epanechinikov', 'box', and 'triangle', are all scaled to have standard deviation equal to one, so the "bandwidth" parameter means roughly the same thing regardless of kernel function.
Using default bandwidths, we now plot the same mileage data, using each of the available kernel smoothers.
hname = {'normal' 'epanechinikov' 'box' 'triangle'};
hold on;
colors = {'r' 'b' 'g' 'm'};
for j=1:4
    [f,x] = ksdensity(MPG,'kernel',hname{j});
    plot(x,f,colors{j});
end
legend(hname{:});
hold off
The density estimates are roughly comparable, but the box kernel produces a density that is rougher than the others.
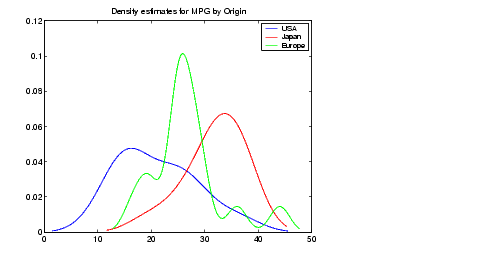
Usefulness of Smooth Density Estimates
In addition to the aesthetic appeal of the smooth density estimate, there are other appeals as well. While it is difficult to overlay two histograms to compare them, you can easily overlay smooth density estimates. For example, the following graph shows the MPG distributions for cars from different countries of origin.
| | Percentiles | Empirical Cumulative Distribution Function | |