

| Statistics Toolbox | |
The aoctool Demo
The aoctool demo is an interactive graphical environment for fitting and prediction with analysis of covariance (anocova) models. It is similar to the polytool demo.
Analysis of covariance is a technique for analyzing grouped data having a response (y, the variable to be predicted) and a predictor (x, the variable used to do the prediction). Using analysis of covariance, you can model y as a linear function of x, with the coefficients of the line possibly varying from group to group. The aoctool function fits the following models for the ith group:
 |
|
 |
|
 |
|
 |
|
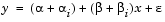 |
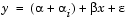
In the fourth model, for example, the intercept varies from one group to the next, but the slope is the same for each group. In the first model, there is a common intercept and no slope. In order to make the group coefficients well determined, we impose the constraints 
 i=
i= i = 0.
The aoctool demo displays the results of the fit in three figure windows. One window displays estimates of the coefficients (, i, , i). A second displays an analysis of variance table that you can use to test whether a more complex model is significantly better than a simpler one. The third, main graphics window has the following features:
The following section provides an illustrative example.
| | Overfitting | Example: aoctool with Sample Data | |