| Stateflow |
  |
Debug the Model During Simulation
The Stateflow Debugger supports functions like single stepping, animating, and running up to a designated breakpoint and then stopping.
These steps show how to step through the simulation using the Debugger:
- Display the Debugger by choosing Debug from the Tools menu of the graphics editor.
- Select the Breakpoints: Chart Entry check box to tell the Debugger you want it to stop simulation execution when the chart is entered.
- Select Start to start the simulation.
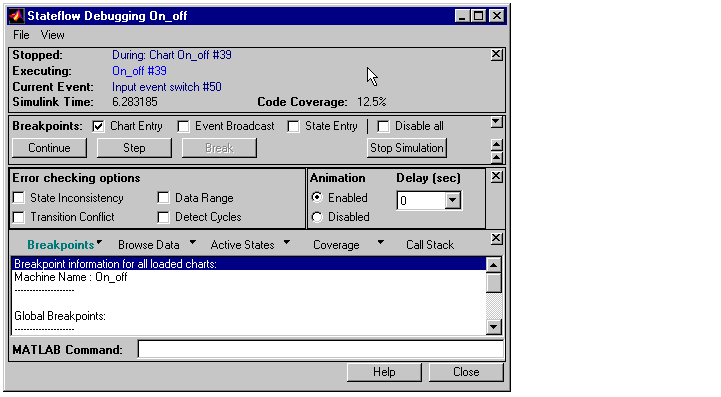
- Informational and error messages related to the S-function code generation for Stateflow blocks are displayed in the MATLAB Command Window. When the target is built, the graphics editor becomes read-only (frozen) and the Debugger window is updated and looks similar to this.

- Select Step to proceed one step through the simulation. The Debugger window displays the following information:
- Where the simulation is stopped
- What is executing
- The current event
- The simulation time
- The current code coverage percentage
- Watch the graphics editor window as you click the Step button to see each transition and state animated when it is executing. After both
Power_off and Power_on have become active by stepping through the simulation, the code coverage indicates 100%.
- Choose Stop from the graphics editor Simulation menu to stop a simulation. Once the simulation stops, the model becomes editable.
- Select Close in the Debugger window.
- Choose Close from the File menu in the Simulink model window.
For More Information
See Debugging and Testing, for more information beyond the debugging topics in this section.
 | Run a Simulation | | Save the Model |  |


