| Stateflow | |
Creating a Stateflow Chart
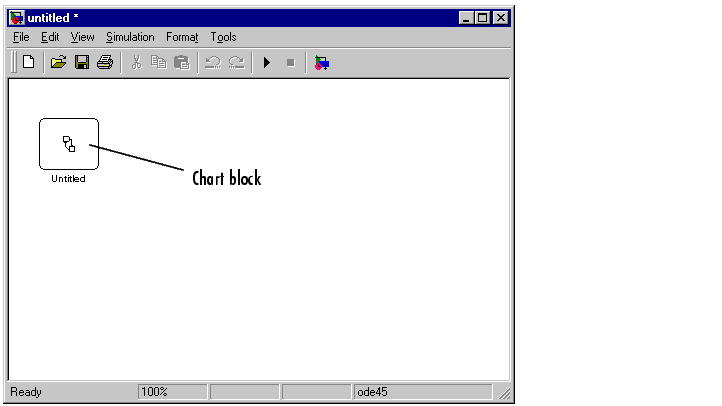
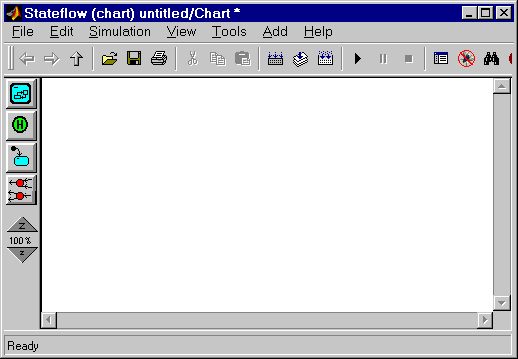
Charts contain a Stateflow diagram that you build with Stateflow objects. You create charts by adding them to a Simulink system. Create a Stateflow chart in a Simulink system with the following steps:
sfnew or stateflow at the MATLAB command prompt to create a new empty model with a Stateflow chart.
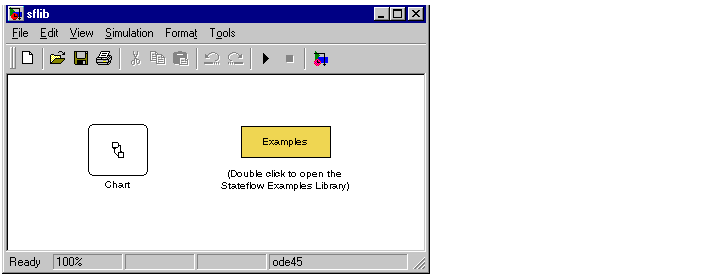
stateflow command also displays the Stateflow block library.
You can drag and drop additional charts in your Simulink system from this library in case you want to create multiple charts in your model. You can also drag and drop new charts into existing systems from the Stateflow library in the Simulink Library browser. For information on creating your own chart libraries, see Creating Chart Libraries.
Once you have constructed a Stateflow diagram, continue with the remaining steps to integrate your chart into its Simulink model:
| Note Trying to save a model with more than 25 characters produces an error. Loading a model with more than 25 characters produces a warning. |
| | Working with Charts | Using the Stateflow Editor | |