
| Simulink Reference |   |
Plot simulation data in a figure window
Syntax
Description
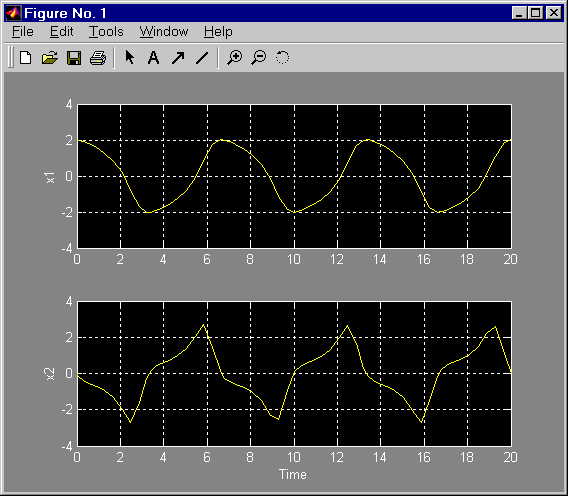
The simplot command plots output from a simulation in a Handle Graphics figure window. The plot looks like the display on the screen of a Scope block. Plotting the output on a figure window allows you to annotate and print the output.
Arguments
data |
Data produced by one of Simulink's output blocks (for example, a root-level Outport block or a To Workspace block) or in one of the output formats used by those blocks: Array, Structure, Structure with time (see The Workspace I/O Pane in the online documentation for Simulink). |
| time |
The vector of sample times produced by an output block when you have selected Array or Structure as the simulation's output format. The simplot command ignores this argument if the format of the data is Structure with time. |
Examples
The following sequence of commands
vdp
set_param(gcs, 'SaveOutput', 'on')
set_param(gcs, `SaveFormat', `StructureWithTime')
sim(gcs)
simplot(yout)
plots the output of the vdp demo model on a figure window as follows.

See Also
 | sim | simset |  |