| Image Processing Toolbox | |
Radon Transform
The radon transform represents an image as a collection of projections along various directions. It is used in areas ranging from seismology to computer vision
The radon function in the Image Processing Toolbox computes projections of an image matrix along specified directions. A projection of a two-dimensional function f(x,y) is a line integral in a certain direction. For example, the line integral of f(x,y) in the vertical direction is the projection of f(x,y) onto the x-axis; the line integral in the horizontal direction is the projection of f(x,y) onto the y-axis. Figure 8-11 shows horizontal and vertical projections for a simple two-dimensional function.
Figure 8-11: Horizontal and Vertical Projections of a Simple Function
Projections can be computed along any angle  . In general, the Radon transform of f(x,y) is the line integral of f parallel to the y´ axis
The figure below illustrates the geometry of the Radon transform.
![]()
Figure 8-12: The Geometry of the Radon Transform
This command computes the Radon transform of I for the angles specified in the vector theta
The columns of R contain the Radon transform for each angle in theta. The vector xp contains the corresponding coordinates along the x´-axis. The "center pixel" of I is defined to be floor((size(I)+1)/2); this is the pixel on the x´-axis corresponding to ![]() .
.
The commands below compute and plot the Radon transform at 0° and 45° of an image containing a single square object.
I = zeros(100,100); I(25:75, 25:75) = 1; imshow(I)[R,xp] = radon(I,[0 45]); figure; plot(xp,R(:,1)); title('R_{0^o} (x\prime)') figure; plot(xp,R(:,2)); title('R_{45^o} (x\prime)')
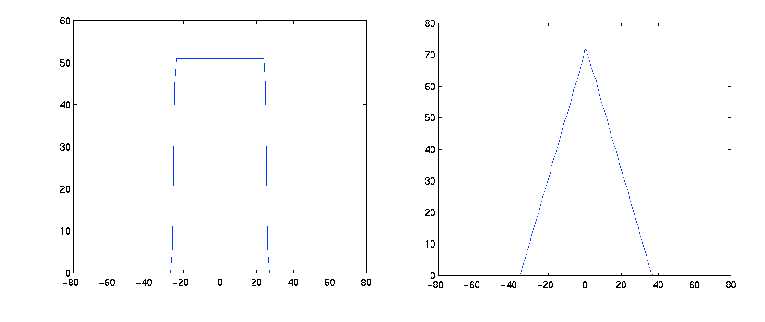
Figure 8-13: Two Radon Transforms of a Square Function
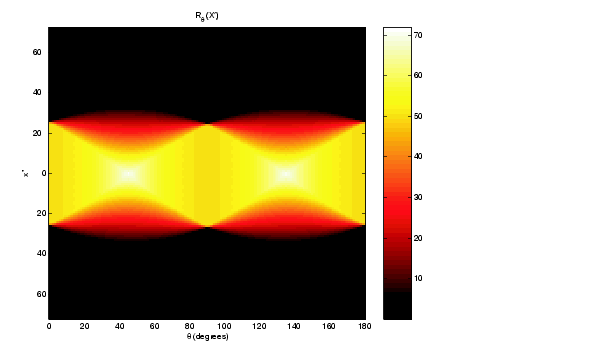
The Radon transform for a large number of angles is often displayed as an image. In this example, the Radon transform for the square image is computed at angles from 0° to 180°, in 1° increments.
theta = 0:180;
[R,xp] = radon(I,theta);
imagesc(theta,xp,R);
title('R_{\theta} (X\prime)');
xlabel('\theta (degrees)');
ylabel('X\prime');
set(gca,'XTick',0:20:180);
colormap(hot);
colorbar
Figure 8-14: A Radon Transform Using 180 Projections
| | The DCT and Image Compression | Using the Radon Transform to Detect Lines | |