
| Image Processing Toolbox |   |
Compute feature measurements for image regions
Note
This function is obsolete and may be removed in future versions. Use regionprops instead.
|
Syntax
Description
stats = imfeature(L,measurements) computes a set of measurements for each labeled region in the label matrix L. Positive integer elements of L correspond to different regions. For example, the set of elements of L equal to 1 corresponds to region 1; the set of elements of L equal to 2 corresponds to region 2; and so on. stats is a structure array of length max(L(:)). The fields of the structure array denote different measurements for each region, as specified by measurements.
measurements can be a comma-separated list of strings, a cell array containing strings, the single string 'all', or the single string 'basic'. The set of valid measurement strings includes the following.
Measurement strings are case insensitive and can be abbreviated.
If measurements is the string 'all', then all of the above measurements are computed. If measurements is not specified or if it is the string 'basic', then these measurements are computed: 'Area', 'Centroid', and 'BoundingBox'.
stats = imfeature(L,measurements,n) specifies the type of connectivity used in computing the 'FilledImage', 'FilledArea', and 'EulerNumber' measurements. n can have a value of either 4 or 8, where 4 specifies 4-connected objects and 8 specifies 8-connected objects; if the argument is omitted, it defaults to 8.
Definitions
'Area' - Scalar; the actual number of pixels in the region. (This value may differ slightly from the value returned by bwarea, which weights different patterns of pixels differently.)
'Centroid' - 1-by-2 vector; the x- and y-coordinates of the center of mass of the region.
'BoundingBox' - 1-by-4 vector; the smallest rectangle that can contain the region. The format of the vector is [x y width height], where x and y are the x- and y-coordinates of the upper-left corner of the rectangle, and width and height are the width and height of the rectangle. Note that x and y are always noninteger values, because they are the spatial coordinates for the upper-left corner of a pixel in the image; for example, if this pixel is the third pixel in the fifth row of the image, then x = 2.5 and y = 4.5.
This figure illustrates the centroid and bounding box. The region consists of the white pixels; the green box is the bounding box, and the red dot is the centroid.

'MajorAxisLength' - Scalar; the length (in pixels) of the major axis of the ellipse that has the same second-moments as the region.
'MinorAxisLength' - Scalar; the length (in pixels) of the minor axis of the ellipse that has the same second-moments as the region.
'Eccentricity' - Scalar; the eccentricity of the ellipse that has the same second-moments as the region. The eccentricity is the ratio of the distance between the foci of the ellipse and its major axis length. The value is between 0 and 1. (0 and 1 are degenerate cases; an ellipse whose eccentricity is 0 is actually a circle, while an ellipse whose eccentricity is 1 is a line segment.)
'Orientation' - Scalar; the angle (in degrees) between the x-axis and the major axis of the ellipse that has the same second-moments as the region.
This figure illustrates the axes and orientation of the ellipse. The left side of the figure shows an image region and its corresponding ellipse. The right side shows the same ellipse, with features indicated graphically; the solid blue lines are the axes, the red dots are the foci, and the orientation is the angle between the horizontal dotted line and the major axis
 .
.
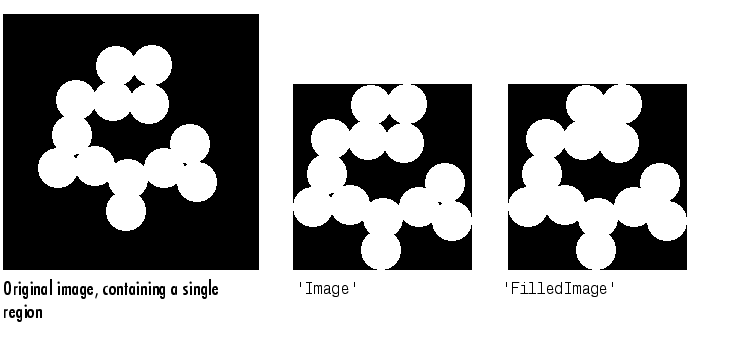
'Image' - Binary image of the same size as the bounding box of the region; the on pixels correspond to the region, and all other pixels are off.
'FilledImage' - Binary image of the same size as the bounding box of the region; the on pixels correspond to the region, with all holes filled in.
'FilledArea' - Scalar; the number of on pixels in FilledImage.
This figure illustrates `Image' and `FilledImage'.

'ConvexHull' - p-by-2 matrix; the smallest convex polygon that can contain the region. Each row of the matrix contains the x- and y-coordinates of one vertex of the polygon.
'ConvexImage' - Binary image (uint8); the convex hull, with all pixels within the hull filled in (i.e., set to on). (For pixels that the boundary of the hull passes through, imfeature uses the same logic as roipoly to determine whether the pixel is inside or outside the hull.) The image is the size of the bounding box of the region.
'ConvexArea' - Scalar; the number of pixels in 'ConvexImage'.
'EulerNumber' - Scalar; equal to the number of objects in the region minus the number of holes in those objects.
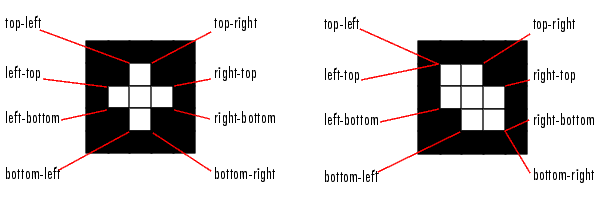
'Extrema' - 8-by-2 matrix; the extremal points in the region. Each row of the matrix contains the x- and y-coordinates of one of the points; the format of the vector is [top-left top-right right-top right-bottom bottom-right bottom-left left-bottom left-top].
This figure illustrates the extrema of two different regions. In the region on the left, each extremal point is distinct; in the region on the right, certain extremal points (e.g., top-left and left-top) are identical.

'EquivDiameter' - Scalar; the diameter of a circle with the same area as the region. Computed as sqrt(4*Area/pi).
'Solidity' - Scalar; the proportion of the pixels in the convex hull that are also in the region. Computed as Area/ConvexArea.
'Extent' - Scalar; the proportion of the pixels in the bounding box that are also in the region. Computed as the Area divided by area of the bounding box.
'PixelList' - p-by-2 matrix; the actual pixels in the region. Each row of the matrix contains the x- and y-coordinates of one pixel in the region.
Class Support
The input label matrix L can be of class double or of any integer class.
Remarks
The comma-separated list syntax for structure arrays is very useful when working with the output of imfeature. For example, for a field that contains a scalar, you can use a this syntax to create a vector containing the value of this field for each region in the image.
For instance, if stats is a structure array with field Area, then these two expressions are equivalent
Therefore, you can use these calls to create a vector containing the area of each region in the image.
allArea is a vector of the same length as the structure array stats.
The function ismember is useful in conjunction with imfeature for selecting regions based on certain criteria. For example, these commands create a binary image containing only the regions in text.tif whose area is greater than 80.
Most of the measurements take very little time to compute. The exceptions are these, which may take significantly longer, depending on the number of regions in L:
Note that computing certain groups of measurements takes about the same amount of time as computing just one of them, because imfeature takes advantage of intermediate computations used in both computations. Therefore, it is fastest to compute all of the desired measurements in a single call to imfeature.
Example
BW = imread('text.tif');
L = bwlabel(BW);
stats = imfeature(L,'all');
stats(23)

ans =

               Area: 89
           Centroid: [95.6742 192.9775]
        BoundingBox: [87.5000 184.5000 16 15]
    MajorAxisLength: 19.9127
    MinorAxisLength: 14.2953
       Eccentricity: 0.6961
        Orientation: 9.0845
         ConvexHull: [13x2  double]
        ConvexImage: [15x16 logical ]
         ConvexArea: 205
              Image: [15x16 logical ]
        FilledImage: [15x16 logical ]
         FilledArea: 122
        EulerNumber: 0
            Extrema: [ 8x2  double]
      EquivDiameter: 10.6451
           Solidity: 0.4341
             Extent: 0.3708
          PixelList: [89x2  double]
See Also
ismember in the MATLAB Function Reference
 | imextendedmin | imfill |  |