| Image Processing Toolbox | |
Image Contours
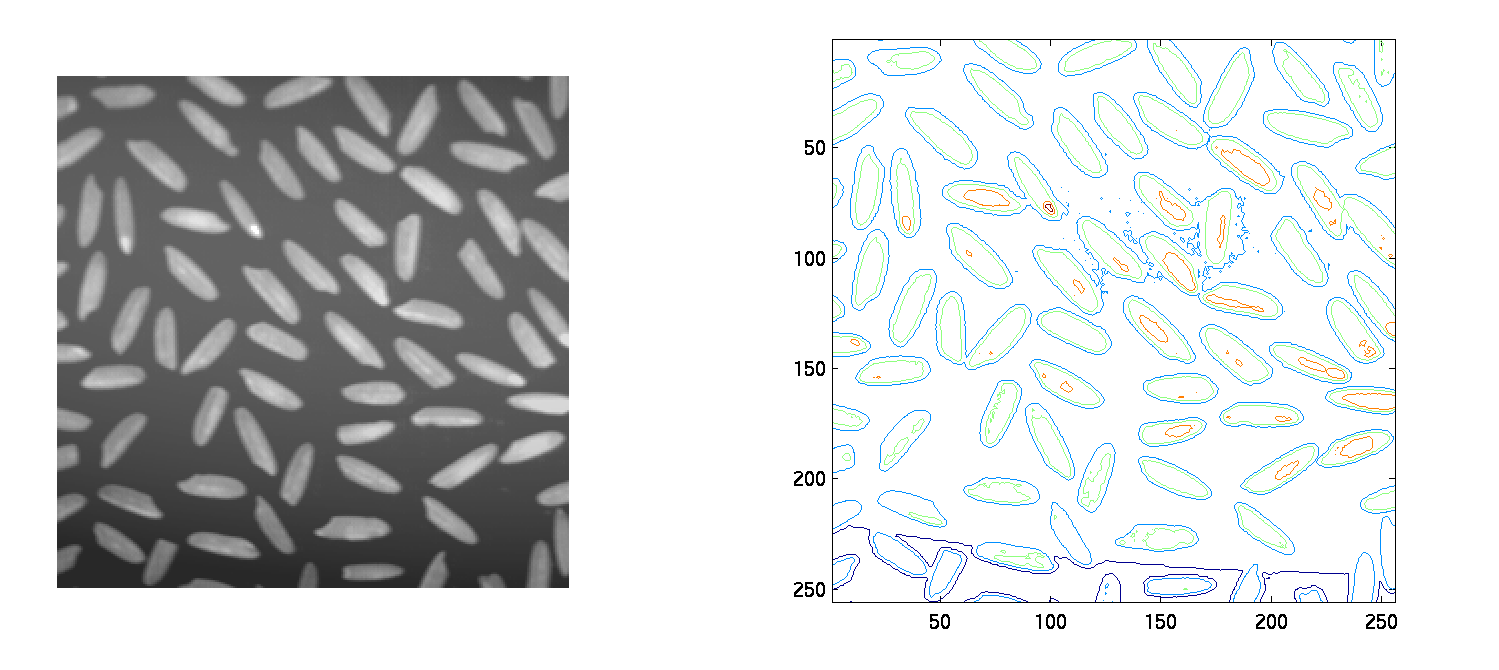
You can use the toolbox function imcontour to display a contour plot of the data in an intensity image. This function is similar to the contour function in MATLAB, but it automatically sets up the axes so their orientation and aspect ratio match the image.
This example displays an intensity image of grains of rice and a contour plot of the image data.
Figure 10-3: Rice.tif and Its Contour Plot
You can use the clabel function to label the levels of the contours. See the description of clabel in the MATLAB Function Reference for details.
| | Intensity Profile | Image Histogram | |