| Image Processing Toolbox | |
Adding a Colorbar
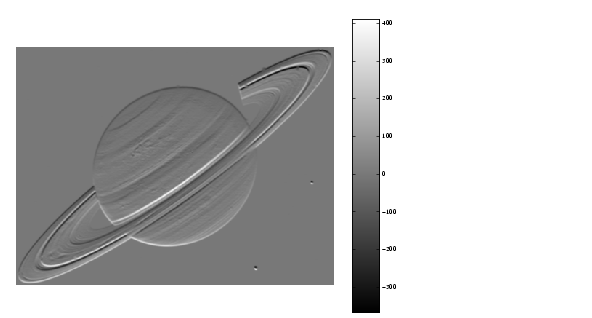
Use the colorbar function to add a colorbar to an axes object. If you add a colorbar to an axes object that contains an image object, the colorbar indicates the data values that the different colors in the image correspond to.
Seeing the correspondence between data values and the colors displayed by using a colorbar is especially useful if you are displaying unconventional range data as an image, as described under Displaying Intensity Images That Have Unconventional Ranges.
In the example below, a grayscale image of class uint8 is filtered, resulting in data that is no longer in the range [0,255].
| | Special Display Techniques | Displaying Multiframe Images | |