
| Financial Time Series Toolbox |   |
Zoom Tool
The zoom feature of chartfts enables a more detailed look at the data during a selected time frame. The Zoom tool is found under the Chart Tools menu.
Note
Due to the specialized nature of this feature, do not use the MATLAB zoom command or Zoom In and Zoom Out from the Tools menu.
|
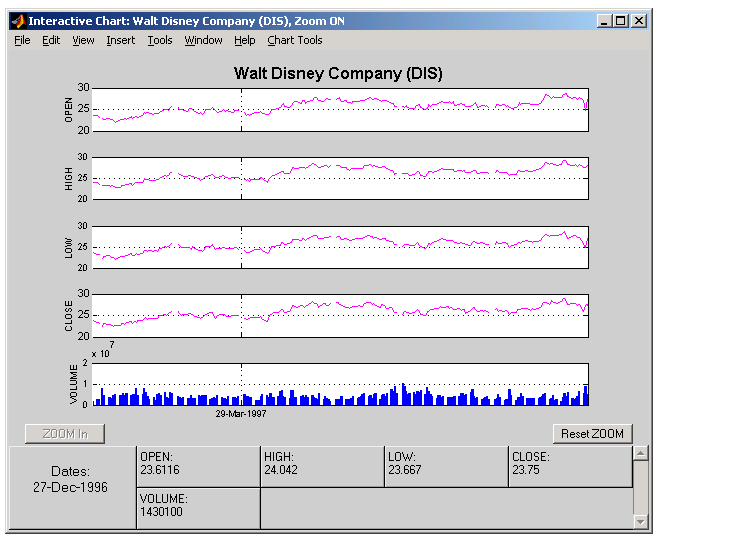
When the feature is turned on, you will see two inactive buttons (ZOOM In and Reset ZOOM) above the boxes. The buttons become active later after certain actions have been performed.
The figure window title bar displays the status of the chart tool that you are using. With the Zoom tool turned on, you see Zoom ON in the title bar in addition to the name of the time series you are working with. When the tool is off, no status is displayed.
To zoom into the chart, you need to define the starting and ending dates. Define the starting date by moving the cursor over the chart until the desired date appears at the bottom left box and click the mouse button. A blue vertical line indicates the starting date you have selected. Next, again move the cursor over the chart until the desired ending date appears in the box and click the mouse once again. This time, a red vertical line appears and the ZOOM In button is activated.
To zoom into the chart, click the ZOOM In button.

The chart is zoomed in. Note that the Reset ZOOM button now becomes active while the ZOOM In button becomes inactive again. To return the chart to its original state (not zoomed), click on the Reset ZOOM button. To zoom into the chart even further, repeat the steps above for zooming into the chart.
Turn the Zoom tool off by going back to the Chart Tools menu and choosing Zoom Off.
With the tool turned off, the chart stays at the last state that it was in. If you turn it off when the chart is zoomed in, the chart stays zoomed in. If you reset the zoom before turning it off, the chart becomes the original (not zoomed).
 | Using chartfts | Combine Axes Tool |  |