
| Tool and Viewer Quick Start |   |
The SISO Design Tool provides support for viewing loop responses for your system. To see available frequency and time domain responses, pull down the Analysis menu.

Choose the response you want to see; an LTI Viewer opens with the view plotted. For example, if you select Response to Step Command, you will see a closed-loop step response of your system.
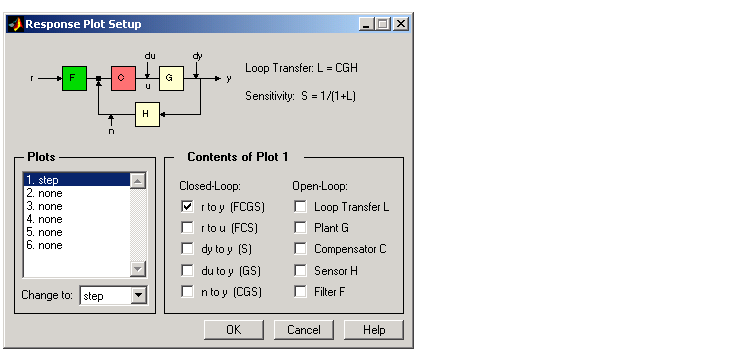
If you select Other, the Response Plot Setup window opens.

This window allows for more specialized loop responses. Click here for more information.
 | Prefilter Bode Diagram | Viewing System Data |  |