Table 3-2: Response Characteristic Options for Response Plots
Plot
|
Customizable Feature
|
Bode Diagram
|
Show peak response
Show minimum stability margins
Show all stability margins
Unwrap phase (default is wrapped)
|
Bode Magnitude
|
Show peak response
|
Impulse
|
Show peak response
Show settling time within xx% (specify the percentage)
|
Nichols Chart
|
Show peak response
Show minimum stability margins
Show all stability margins
Unwrap phase (default is wrapped)
|
Nyquist Diagram
|
Show peak response
Show minimum stability margins
Show all stability margins
|
Pole/Zero Map
|
None
|
Sigma
|
Show peak response
|
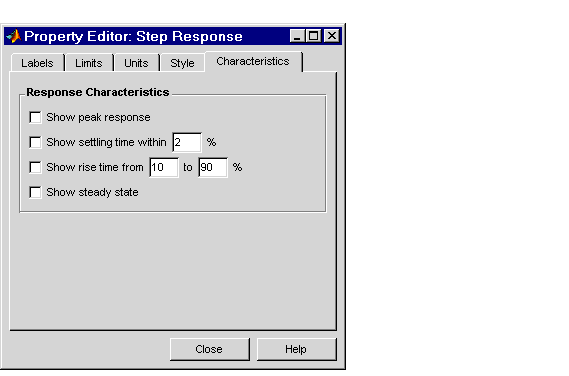
Step
|
Show peak response
Show settling time within xx% (specify the percentage)
Show rise time from xx to yy% (specify the percentages)
Show steady state
|