| 3-D Visualization | |
Modifying the Color Mapping
The current colormap determines the coloring of the slice planes. This enables you to change the slice plane coloring by
Suppose, for example, you are interested in data values only between -5 and 2.5 and would like to use a colormap that mapped lower values to reds and higher values to blues (that is, the opposite of the default jet colormap).
Customizing the Colormap
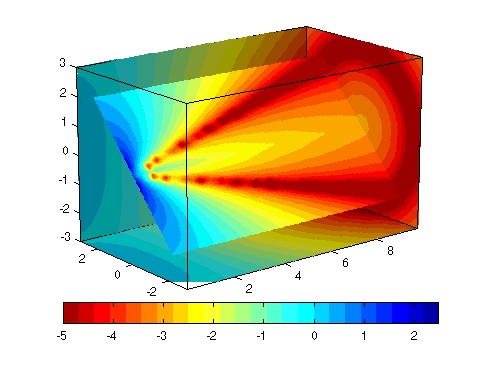
The first step is to flip the colormap (colormap, flipud).
Adjusting the Color Limits
Adjusting the color limits enables you to emphasize any particular data range of interest. Adjust the color limits to range from -5 to 2.4832 so that any value lower than the value -5 (the original data ranged from -11.5417 to 2.4832) is mapped into to same color. (See caxis and the "Axis Color Limits - The CLim Property section in the "Axes Properties" chapter for an explanation of color mapping.)
Adding a color bar provides a key for the data to color mapping.
| | Example - Slicing Fluid Flow Data | Connecting Equal Values with Isosurfaces | |