
| MATLAB Function Reference |   |
Syntax
Description
The polar function accepts polar coordinates, plots them in a Cartesian plane, and draws the polar grid on the plane.
polar(theta,rho)
creates a polar coordinate plot of the angle theta versus the radius rho. theta is the angle from the x-axis to the radius vector specified in radians; rho is the length of the radius vector specified in dataspace units.
polar(theta,rho, LineSpec)
LineSpec specifies the line type, plot symbol, and color for the lines drawn in the polar plot.
Examples
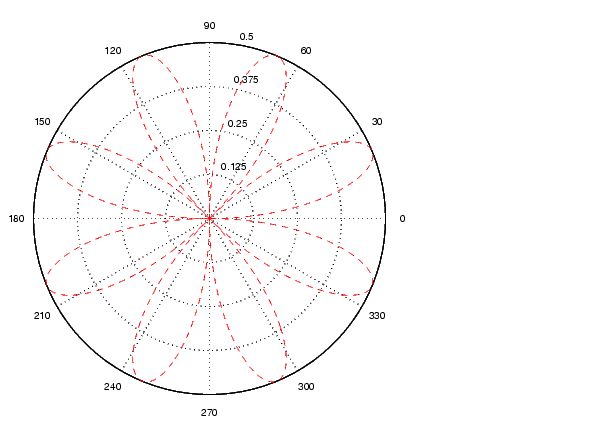
Create a simple polar plot using a dashed, red line:
t = 0:.01:2*pi;
polar(t,sin(2*t).*cos(2*t),'--r')

See Also
cart2pol, compass, LineSpec, plot, pol2cart, rose
 | pol2cart | poly |  |