
| MATLAB Function Reference |   |
Graphically display the structure of cell arrays
Syntax
Description
cellplot(c)
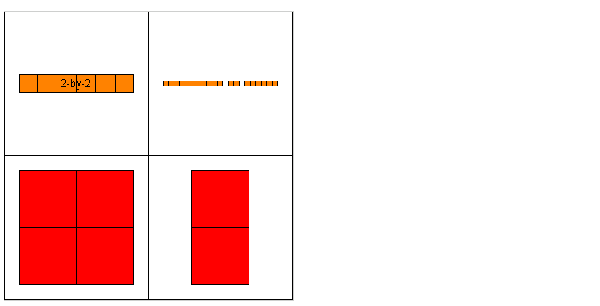
c. Filled rectangles represent elements of vectors and arrays, while scalars and short text strings are displayed as text.
cellplot(c,'legend')
also puts a legend next to the plot.
handles = cellplot(c)
Limitations
The cellplot function can display only two-dimensional cell arrays.
Examples
Consider a 2-by-2 cell array containing a matrix, a vector, and two text strings:
The command cellplot(c) produces:

 | cellfun | cellstr |  |