| Printing and Exporting Figures with MATLAB |
  |
Example - Fine-Tuning a Figure
This example shows how you might fine tune a figure for printing by setting the renderer, retaining the background color, and locking the axes ticks and limits.
This example first shows how to make the settings using the user interface, then by using MATLAB commands.
Using the User Interface
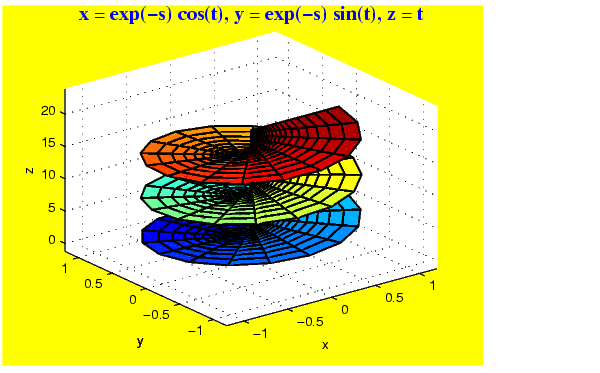
- Create a figure using the following code.
ezsurf('exp(-s)*cos(t)','exp(-s)*sin(t)','t',[0,8,0,6*pi])
- From the figure window's Edit menu, select Figure Properties. This invokes the Property Editor, which displays a set of panels associated with the figure.
- You can change the set of panels displayed in the Property Editor by clicking on different areas in your figure window. Click outside the axes. Select Yellow from the Background Color list box. Click Apply.
- From the figure window's File menu, select Page Setup. This invokes the Page Setup dialog box.
- Open the Axes and Figure tab. Select Keep screen limits and ticks so that MATLAB will not rescale the limits and ticks when you print or export the figure.
- Select Keep screen background color so that MATLAB will not invert the background to white when you print or export the figure.
- Select OpenGL from the Figure Renderer scroll list. This will use a bitmap approach to rendering the figure, which is suitable for a figure of this complexity.
- Click OK to save the settings with the figure.
The following picture illustrates the results.
Using MATLAB Commands
Here's how to make the same settings using MATLAB commands.
- Create the figure.
ezsurf('exp(-s)*cos(t)','exp(-s)*sin(t)','t',[0,8,0,6*pi])
- Set the figure background color to yellow.
- Prevent MATLAB from changing the background color to white in the output.
- Prevent MATLAB from rescaling your ticks when your output the figure.
set(gca,'XTickMode','manual','YTickMode','manual','ZTickMode',
'manual')
- Set the renderer to OpenGL.
| | Creating CMYK Output | | Exporting | |