| Mathematics | |
Introduction
For length N input sequence x, the DFT is a length N vector, X. fft and ifft implement the relationships
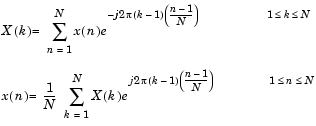
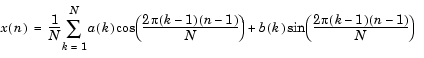
If x(n) is real, we can rewrite the above equation in terms of a summation of sine and cosine functions with real coefficients

Finding an FFT
y =
6.0000
11.4853 - 2.7574i
-2.0000 -12.0000i
-5.4853 +11.2426i
18.0000
-5.4853 -11.2426i
-2.0000 +12.0000i
11.4853 + 2.7574i
Notice that although the sequence x is real, y is complex. The first component of the transformed data is the constant contribution and the fifth element corresponds to the Nyquist frequency. The last three values of y correspond to negative frequencies and, for the real sequence x, they are complex conjugates of three components in the first half of y.
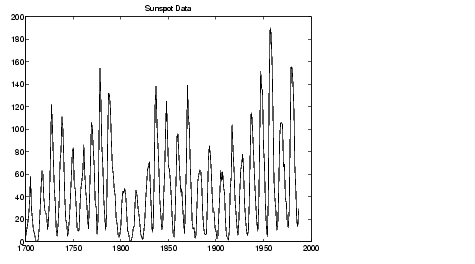
Example: Using FFT to Calculate Sunspot Periodicity
Suppose, we want to analyze the variations in sunspot activity over the last 300 years. You are probably aware that sunspot activity is cyclical, reaching a maximum about every 11 years. Let's confirm that.
Astronomers have tabulated a quantity called the Wolfer number for almost 300 years. This quantity measures both number and size of sunspots.
Load and plot the sunspot data.
load sunspot.dat
year = sunspot(:,1);
wolfer = sunspot(:,2);
plot(year,wolfer)
title('Sunspot Data')
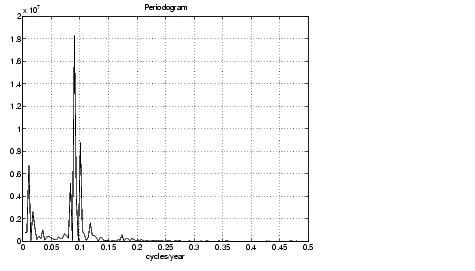
Now take the FFT of the sunspot data.
The result of this transform is the complex vector, Y. The magnitude of Y squared is called the power and a plot of power versus frequency is a "periodogram." Remove the first component of Y, which is simply the sum of the data, and plot the results.
N = length(Y);
Y(1) = [];
power = abs(Y(1:N/2)).^2;
nyquist = 1/2;
freq = (1:N/2)/(N/2)*nyquist;
plot(freq,power), grid on
xlabel('cycles/year')
title('Periodogram')
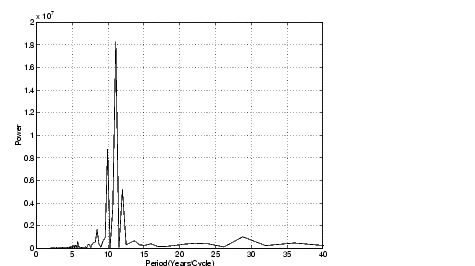
The scale in cycles/year is somewhat inconvenient. Let's plot in years/cycle and estimate what one cycle is. For convenience, plot the power versus period (where period = 1./freq) from 0 to 40 years/cycle.
period = 1./freq;
plot(period,power), axis([0 40 0 2e7]), grid on
ylabel('Power')
xlabel('Period(Years/Cycle)')
In order to determine the cycle more precisely,
| | Function Summary | Magnitude and Phase of Transformed Data | |