| Signal Processing Toolbox |
  |
Opening the Filter Viewer
You can open the Filter Viewer from SPTool by:
- Selecting one or more filters in the Filters list in SPTool
- Pressing the View button under the Filters list
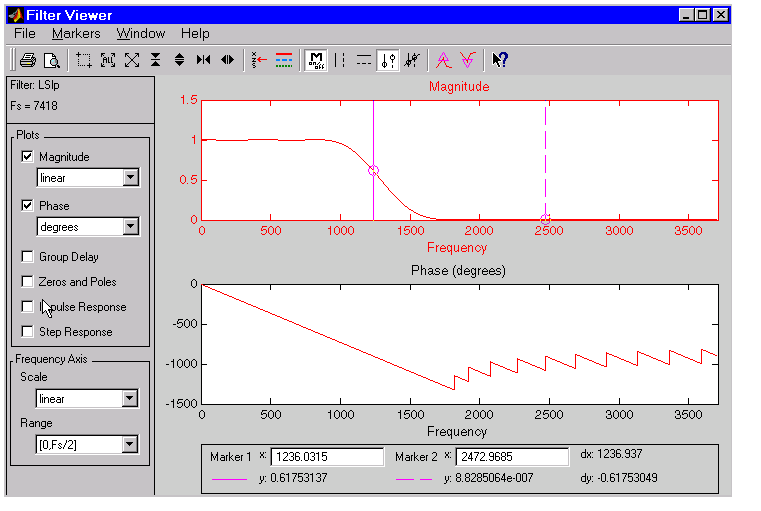
When you first open the Filter Viewer, it displays the default plot configuration for the selected filter(s).

The filter's magnitude and phase plots are displayed by default. In addition, the frequency is displayed with a linear scale on the interval [0,Fs/2].
The Filter Viewer has the following components:
- A filter identification region that displays the filter name and sampling frequency for the currently selected filter(s)
- A Plots region for selecting the response plots you want to display in the display area, and for specifying some frequency response display characteristics
- A Frequency Axis region for specifying frequency scaling in the display area
- A display area for analyzing one or more frequency response plots for the selected filter(s)
- A marker measurements area
- A toolbar with buttons for convenient access to frequently used functions

|
Print and print preview
|

|
Zoom the signal in and out
|

|
Select one of several loaded signals
|

|
Set the display color and line style of a signal
|

|
Toggle the markers on and off
|

|
Set marker types
|

|
Turn on the What's This help
|
 | Filter Viewer | | Spectrum Viewer |  |


