

| System Identification Toolbox | |
Getting Input-Output Data into the GUI
The information about a data set that should be supplied to the GUI is as follows:
In addition to this mandatory information, you may add further properties that will help in the bookkeeping:
As you select the pop-up menu Data and choose the item Import, a dialog box will open, where you can enter the information items 1 - 8, just listed. This box has five fields for you to fill in.
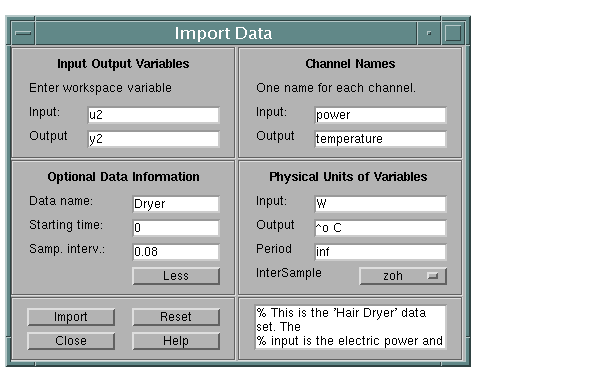
Figure 2-2: The Dialog for Importing Data into the GUI
By pressing More, six more fields will become visible.
Input and Output: Enter the variable names of the input and output respectively. These should be variables in your MATLAB workspace, so you may have to load some disk files first.
Actually, you can enter any MATLAB expressions in these fields, and they will be evaluated to compute the input and the output before inserting the data into the GUI.
Data name: Enter the name of the data set to be used by the GUI. This name can be changed later on.
Starting time and Sampling interval: Fill these out for correct time and frequency scales in the plots.
On the extra page you optionally can fill out
Channel names: Enter strings for the different input and output channels names. Separate the strings by comma. The number of names must be equal to the number of channels. If these entries are not filled out, default names, y1,y2, ..., u1, u2 ..., will be used.
Channel units: Enter, in analogous format, the units in which the measurements are made. These will follow to all models built from data, but are used only for plot information.
Period: If the input is periodic, enter here the period length. `Inf' means a non-periodic input, which is default.
Intersample: Choose the intersample behavior of the input as one of ZOH (zero-order hold, i.e., the input signal piecewise constant between the samples) or FOH (first-order hold, i.e., the input signal is piecewise linear between the samples) or BL (Band-limited, i.e., the continuous time input signal has no power above the Nyquist frequency). ZOH is default.
The box at the bottom is for Notes, where you can enter any text you want to accompany the data for bookkeeping purposes.
Finally, select Import to insert the data into the GUI. When no more data sets are to be inserted, select Close to close the dialog box. Reset will empty all the fields of the box.
The procedure just described will create an iddata object, with all its properties. If you already have an iddata object available in the workspace, you can import that directly by selecting the data format Iddata Object in the pop-up menu at the top of the Import Data dialog.
| | Handling Data | Taking a Look at the Data | |